
TomTom builds maps. And building maps is all about data: collecting data, managing and understanding data, refining data, representing and visualizing data. However, there is a number of steps that a piece of data needs to take before it can contribute as information, something that is meaningful to a human user.
Data playground
Modern maps contain a lot of dynamic data, such as e.g. information on traffic. To keep them as accurate as possible (close to real-time), the map needs to be updated frequently (more on map quality can be found in the article How do you know if your map is good?). Any piece of data, which helps in achieving this goal and meets product expectations (including value added and cost of retrieval) is desirable. Facing a lot of data can often be similar to a situation of a kid in front of a big box full of colorful building blocks: everything seems so interesting and inviting, but you do not really know where to start. Bringing some order into the collection will help you move forward, though. One of the common methods of such ordering in data context is aggregation. But before the data can be aggregated and later visualized as a map feature it usually needs some fixing beforehand.
 Data scientist facing a lot of data can be like a kid in front of a box full of colorful blocks (image: author).
Let’s think about a child and a box of building blocks. A child willing to play could start with:
- selecting only interesting pieces and removing the rest,
- grouping related pieces together and fixing/adjusting, if they are in undesirable shape,
- combining single pieces into bigger components,
- and finally attaching components to other preexisting elements.
Building a map can be very similar to the play scenario and each step has its own challenges:
- Filter data: which data is helpful in achieving our goals and which can be ignored? Is some data broken and should be rejected?
- Group and refine data: which pieces of data describe the same reality and thus may or should be considered together? Can the data be improved?
- Aggregate data: how to combine a lot of data pieces into something more meaningful and handy for further steps?
- Update map: how to effectively change the existing map using the new data without breaking anything?
Each of the above phases can be further decomposed. In this article we will shortly introduce a process of grouping and refining the data, which describes vehicle motion pattern. We assume the data is already collected and initially filtered. We will neither address the issue of aggregation nor of map update. Please, keep in mind, there are also other grouping and refining processes applied to different types of data and at various stages of a map production process.
Fixing geospatial data
Maps nowadays need to be so detailed, they rely on many sources of information. The data sources may differ by their availability, frequency of updates, geographical coverage, features they offer, cost of retrieval and positional accuracy. Positional accuracy is essential for providing high precision maps delivered by TomTom. Only highly accurate maps can be effectively utilized for the purpose of navigation by humans and robots. The process we are presenting in this article focuses on positional properties of the source data.
The most common source of geospatial data used for map creation is localization data collected from smartphones and from passenger cars. Smartphone-related data typically describes localization of the device only. Data retrieved from passenger cars describes not only location of the car itself, but also of surrounding objects observed by a car, e.g. traffic signs, traffic lights or elements of the road infrastructure. The nature of this data enables creating static map features, i.e. such features which change slowly, e.g. roadnetwork; as well as dynamic map features, i.e. the ones, which require frequent updates, e.g. traffic flow or variable speed limits. Typically, geospatial data collected from passenger cars is represented as traces (trajectories) and consists of two main components:
- Global Navigation Satellite System (GNSS) providing absolute object position (the commonly known GPS is only one of GNSS systems).
- Inertial Measurement Unit (IMU) providing information on relative object motion, mainly based on accelerometer and gyroscope measurements. IMU data is also called ego-motion or odometry data.
Both sources have their strengths and weaknesses: GNSS accuracy can deteriorate in bad weather conditions or in urban canyons, IMU suffers from a drift issue (drift is caused by properties of the measurement hardware - mainly its non-ideal sampling frequency - and mathematical operation of integration; approximation of motion cannot thus be perfect and the approximation error increases over time). Both systems can also operate with different measurement cycles resulting in producing two data sets, which are not synchronized with each other. Combination of these two sources, when done smartly, is expected to provide better geospatial data than from any of them used separately. The process of combining datasets is called sensor fusion and is one of the first steps in the map creation pipeline, just after data collection and basic filtering. Since both data components have their own uncertainities, it is better to speak about probabilistic sensor fusion, leading to an estimate of the vehicle’s trajectory that is more accurate than either sensor could provide on its own. This is done by using probabilistic models to represent the uncertainty in the measurements from each sensor and combining them using statistical techniques such as Kalman filtering or particle filtering. Particularly, localization data on objects surrounding the vehicle is highly valuable for the purpose of map creation. The idea of sensor-fusion is depicted in the image below:
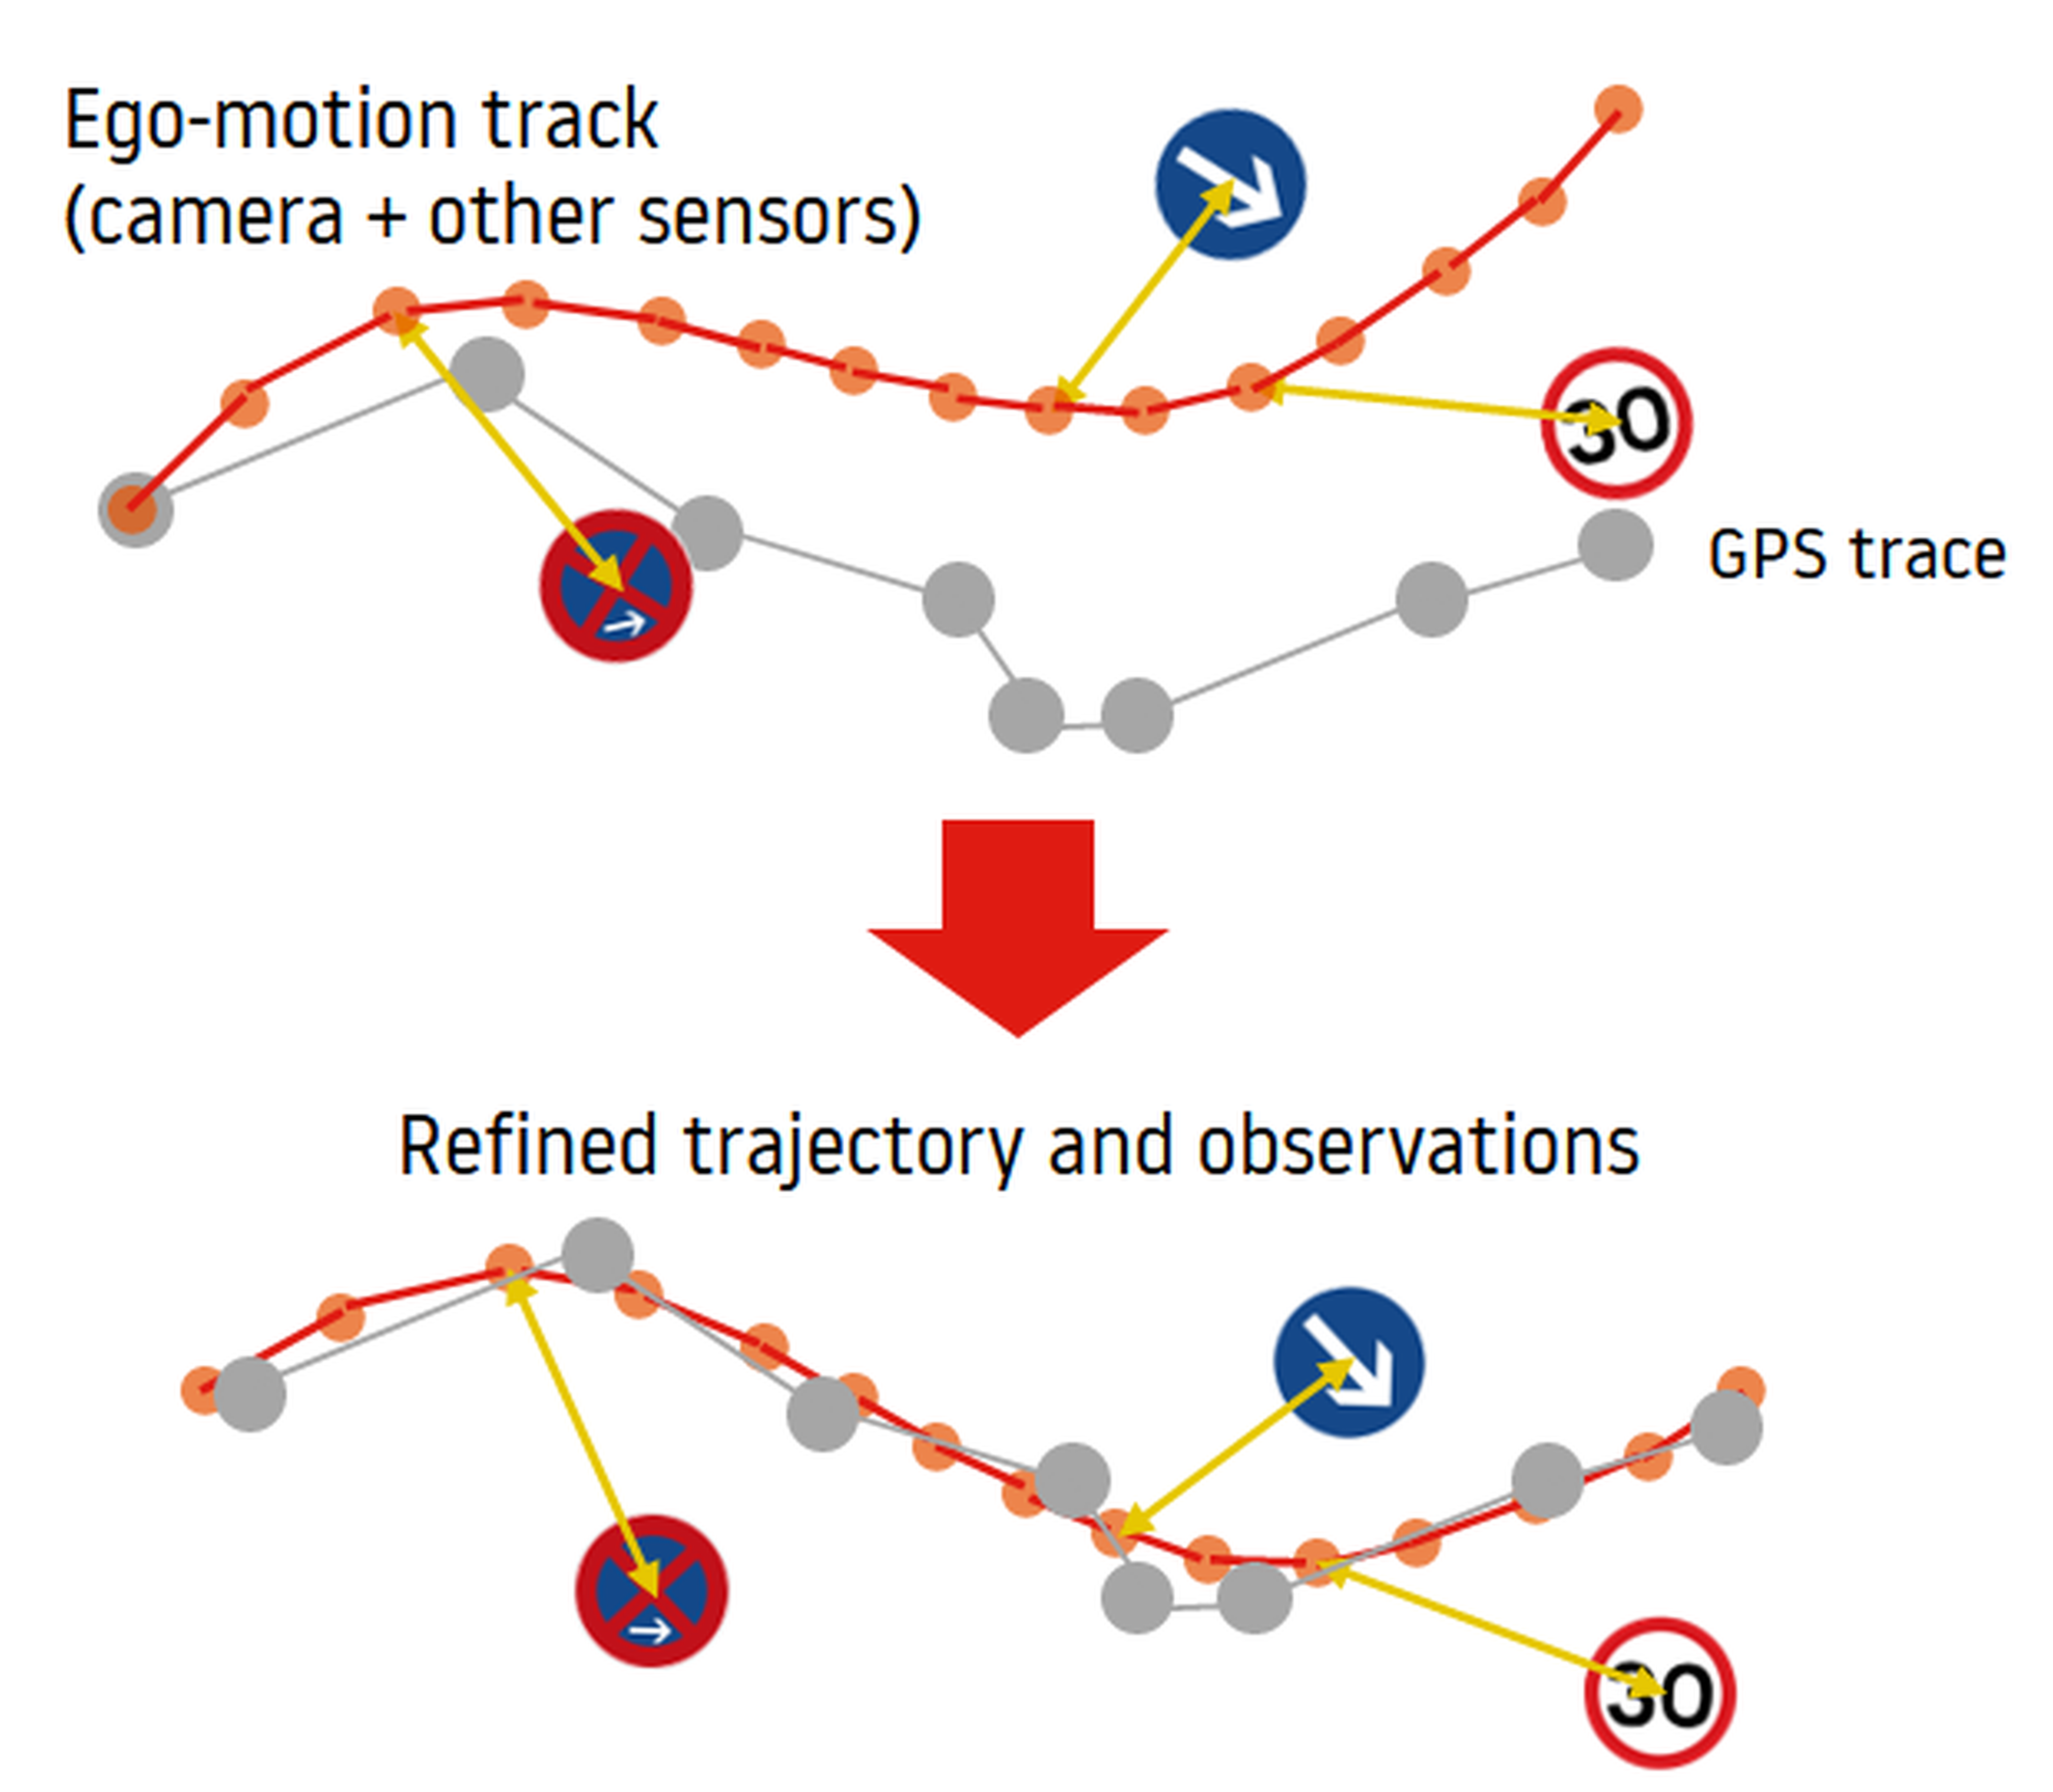 Sensor-fusion: GNSS (GPS) data and IMU data are combined to improve localization (image: team resources).
Learning from the crowd
Sensor-fusion can improve quality of the data coming from various sensors describing the motion pattern of a single vehicle (and the properties of objects surrounding the vehicle). The power of data collected from vehicles lies however not necessarily in its precision, but in its density and freshness: there are namely many cars passing through a given area every day (or even every minute in areas with high traffic) and thus effectively re-measuring the reality with high frequency. What a great potential to keep maps up-to-data and accurate! At the same time each piece of data, even after sensor-fusion, may contain specific errors, depending on the sensor technology and conditions in which the data was collected. However, when considering a short period of time (let’s ignore the exact definition for a while) it may be assumed that actual reality observed by sensors of various vehicles was the same (unchanged). If so, a collection of sensor-fused traces can be used to draw conclusions about the reality (environment) with higher confidence than from a single trace only. This is achieved in the process of smoothing and mapping, called alignment, in which multiple sensor-fused traces and observations are probabilistically shifted to further improve their ability to describe the reality. Due to using multiple sensor-fused observations and a probabilistic approach the overall understanding of reality improves, even if single observations are not fully compatible, that is if for example they provide various information on real objects detected by vehicle sensors. The idea of alignment is depicted in the image below:
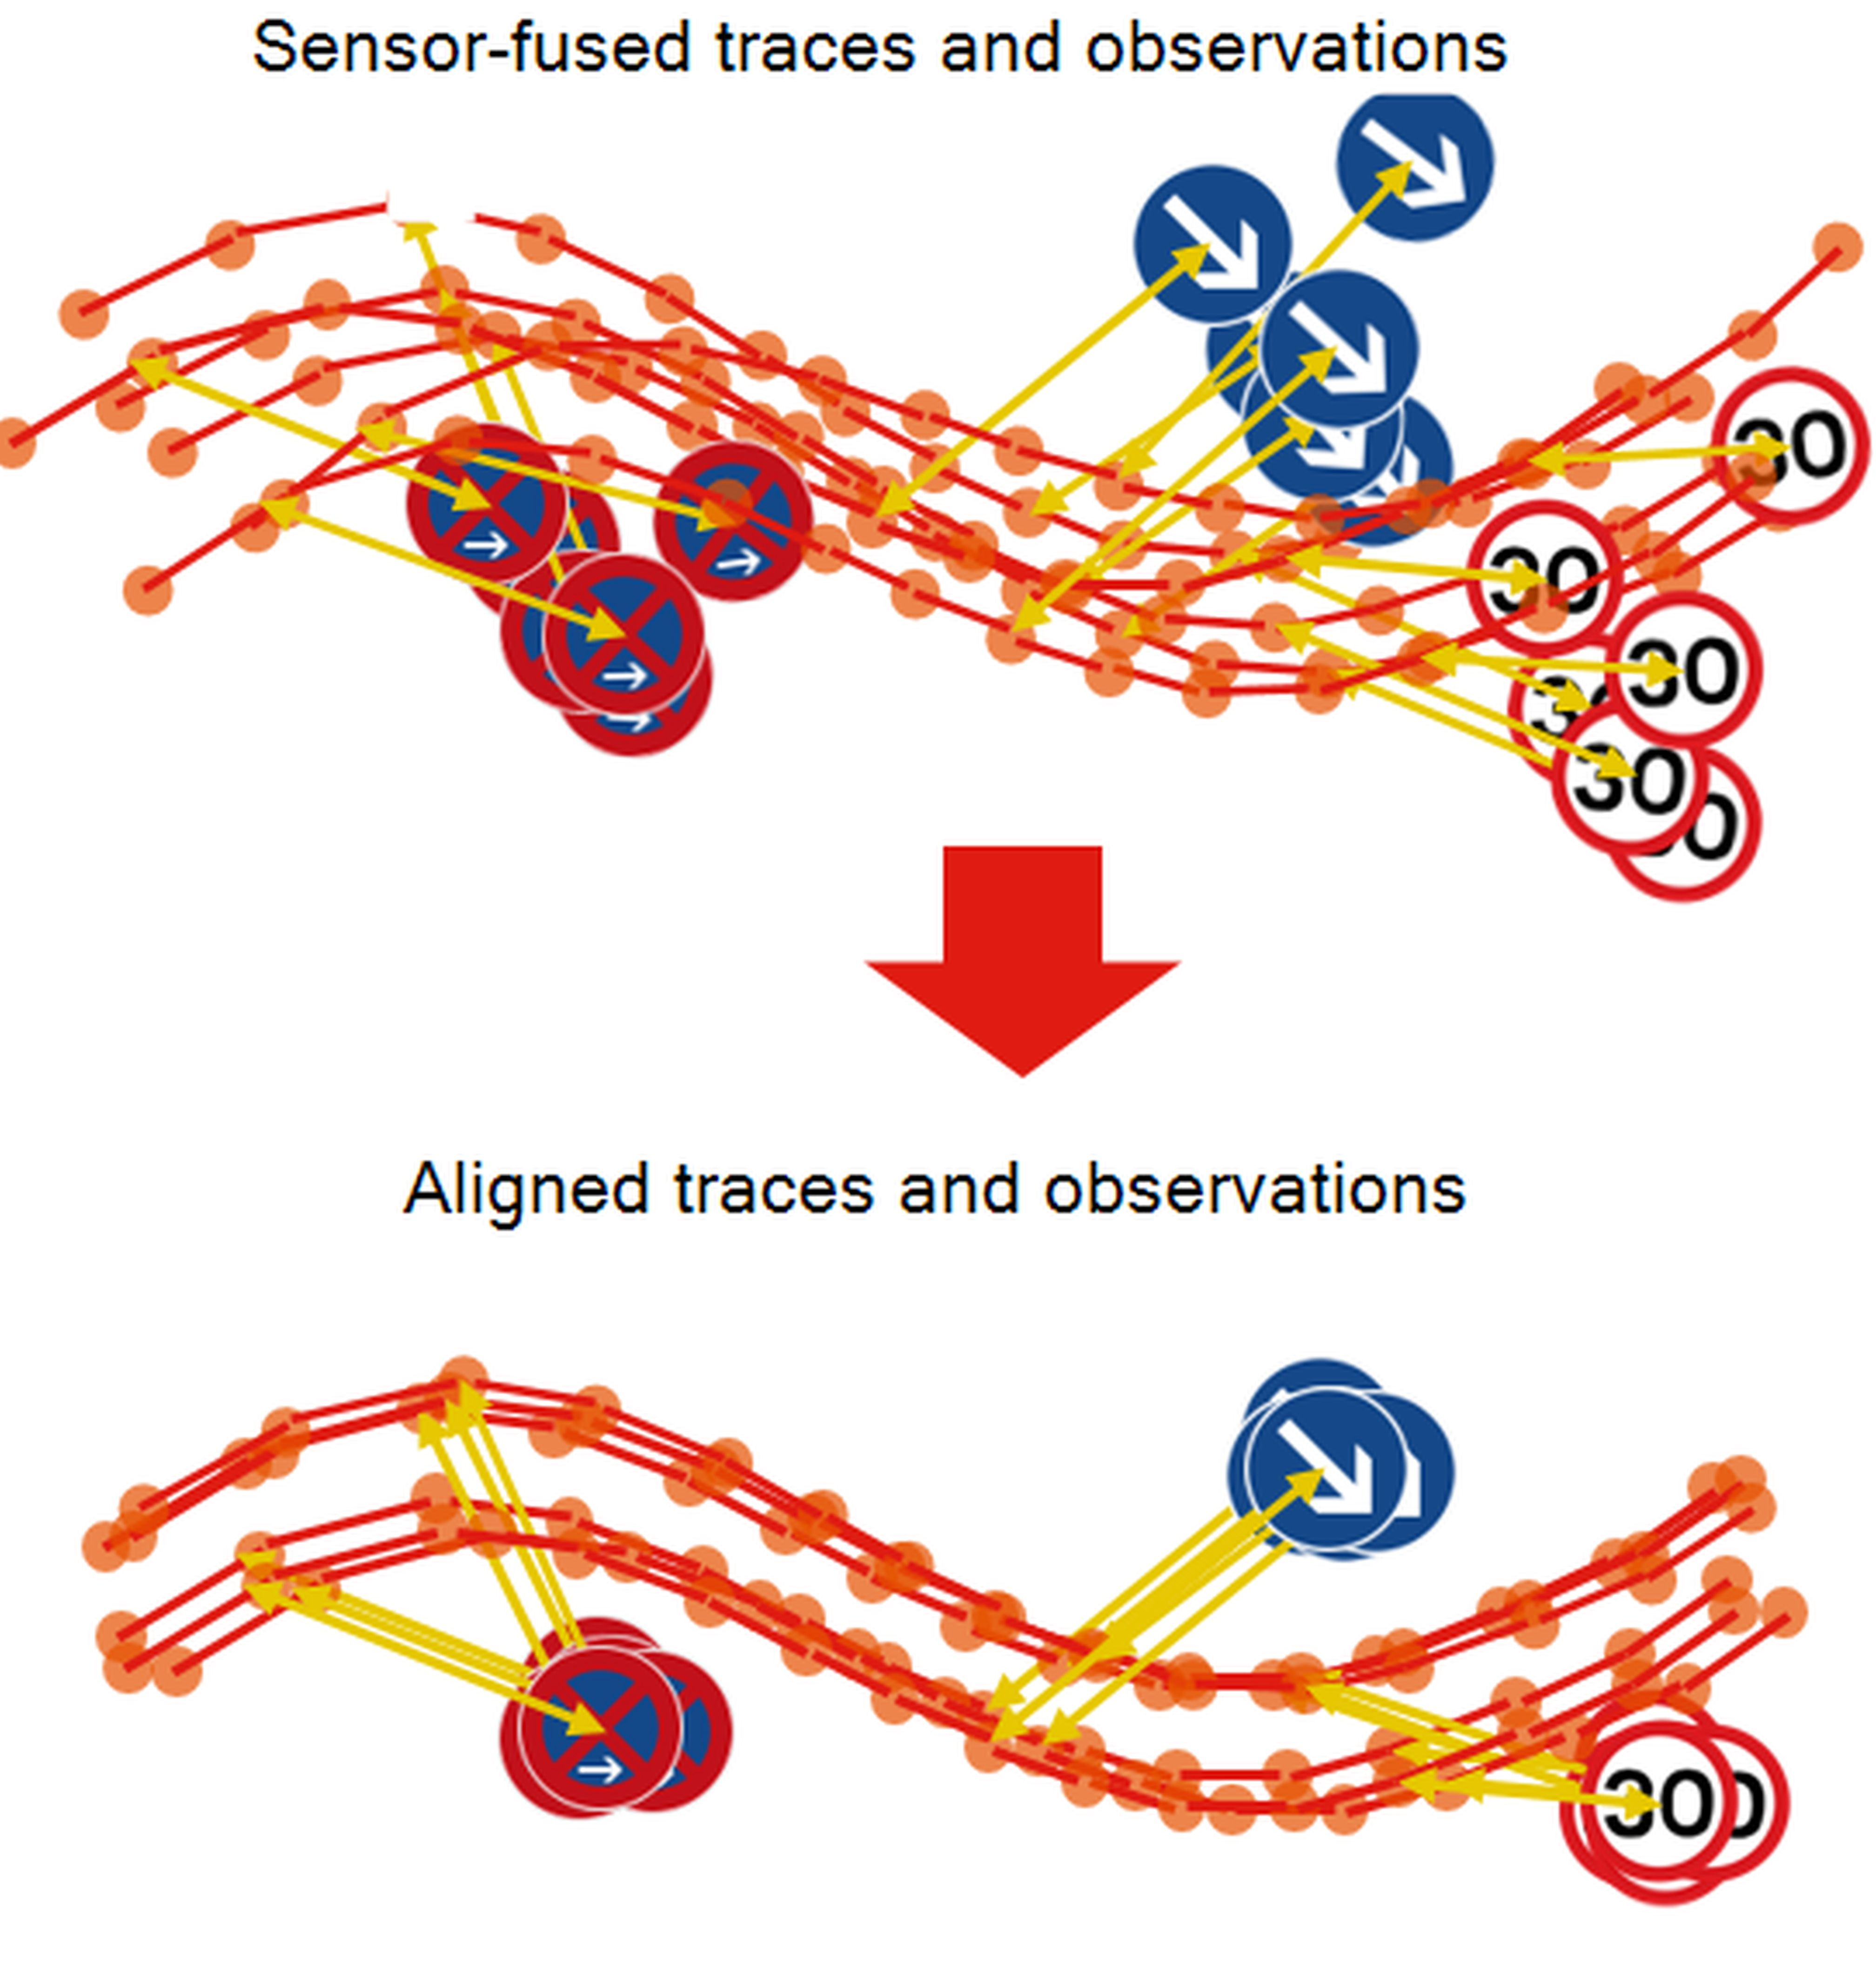 Alignment: multiple sensor-fused traces are shifted to improve their reality description potential (image: team resources).
Aligned data can then be much more easily aggregated to obtain single-object representation of reality. Such compact representation can further be used to create or update selected map features, such as e.g. speed limits, traffic signs, pedestrian crossings or to support the delivery of lane-level traffic information.
Above we assumed short period of time in which the reality observed by vehicle sensor remains unchanged. What would happen, if this was not the case? Due to probabilistic approach new data obtained from changed reality will gradually decrease the confidence about an old map feature and start creating a new map feature. Confidence level of a new map feature will be increasing as more data on changed reality keeps arriving. Ultimately, confidence about new reality will reach the expected level (which may differ from case to case) to allow updating respective map features. And the same time confidence of old map features will fall below the expected confidence level and thus will trigger the removal of the feature from the map. In other words, thanks to continuous data flow and probabilistic modeling map features are generated based on the most recent data and outdated features are deleted automatically.
Technology
Software components used in the above described processes implement methods known in professional literature (mainly from areas of robotics, computer vision, machine learning, and automation) with TomTom specific adaptations and extensions. Short listing of selected technologies and libraries used in works around sensor-fusion and alignment may be helpful to depict the complexity of the challenge:
- GTSAM, EUCLID, EJML for sensor fusion and mathematical operations,
- Gradle, Artifactory, Azure Devops, GitHub to support development processes,
- Grafana, GeoPandas, QGIS for monitoring, debugging and visualization.
Building maps is a complex process, which requires collecting a lot of data and reasoning from it. This is surely not a simple push forward process: collect sensor data and add it to a map. A lot of improvements need to be done before the data ends up in a final product. One of the key improvements, namely positional accuracy improvement of vehicle-retrieved data, was introduced in this article. This is only one of the exciting challenges TomTom engineers face every day.
 Migration of LDAP based IDP to AWS Cognito