A matter of trust in old-school industry
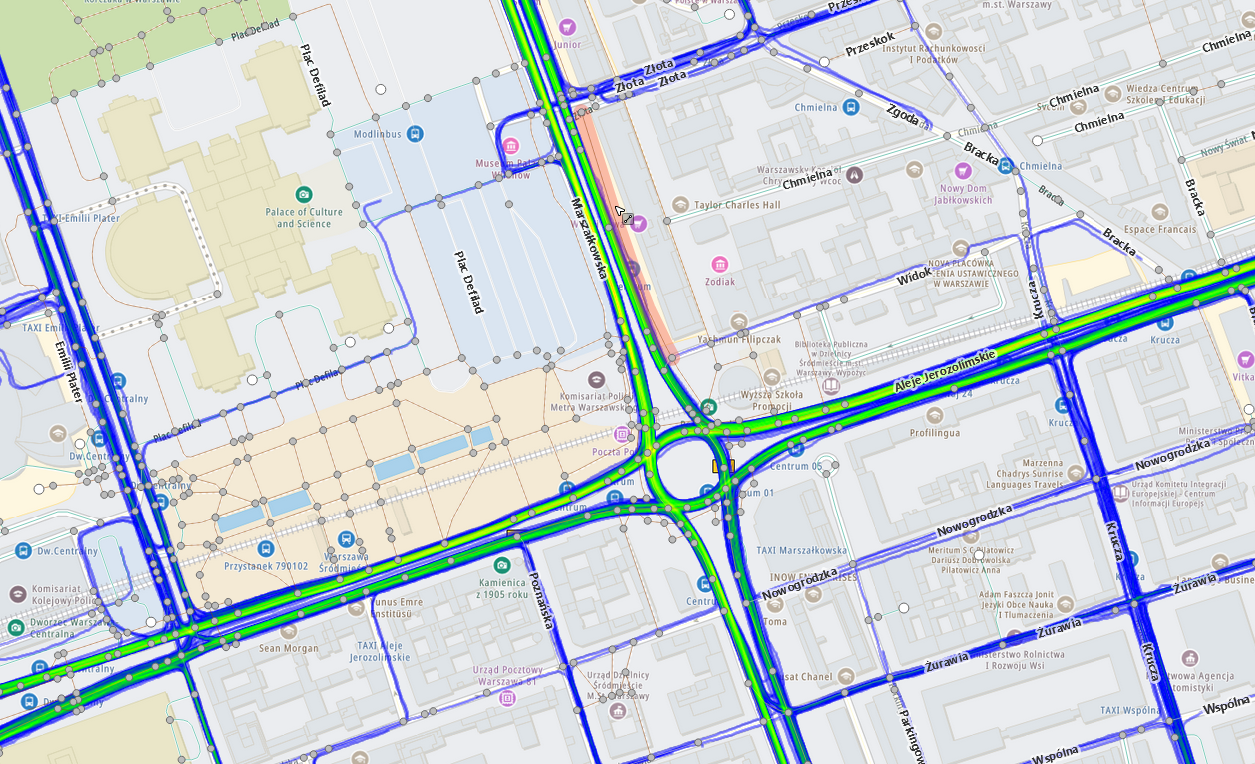
As a human you have basic trust in a map you use. When you see an object on a map you assume it also exists in the real world. If you are looking for a specific address and you find it on a map, you believe you will find it in the corresponding real location. When you are trekking and a map says there’s a river before you and you cannot pass, you’d rather not start considering, that maybe this is just a map error. Furthermore, in the today’s world of digitalization you also expect dynamic information, for example about traffic jams, to be accurate and always up-to-date. To meet such high user expectations TomTom as a map producer needs to constantly check the quality of the map. But how to prove the map TomTom produces is actually a good map?
Let’s imagine you are owner of a factory producing traditional wooden folding rulers some 100 years ago. As a folding ruler producer you need to focus on number of features, such as usability, cost of production, product-market-fit and quality. Let’s focus on the quality aspect in this post. The important part of the quality would be: measurement correctness – you want to be sure than one meter marked on your product corresponds to the actual, real one meter of distance. Today, meter definition is based on physical constants, but 100 years ago it was based on an internationally recognized physical bar, called International Prototype Meter. To be sure your wooden rulers are accurate, you would have to compare them with the International Prototype Meter bar. At this stage you would face at least two challenges:
- How to provide constant and easy access to the International Prototype Meter bar?
- How to assure that comparison between the bar and your wooden ruler is errorless?
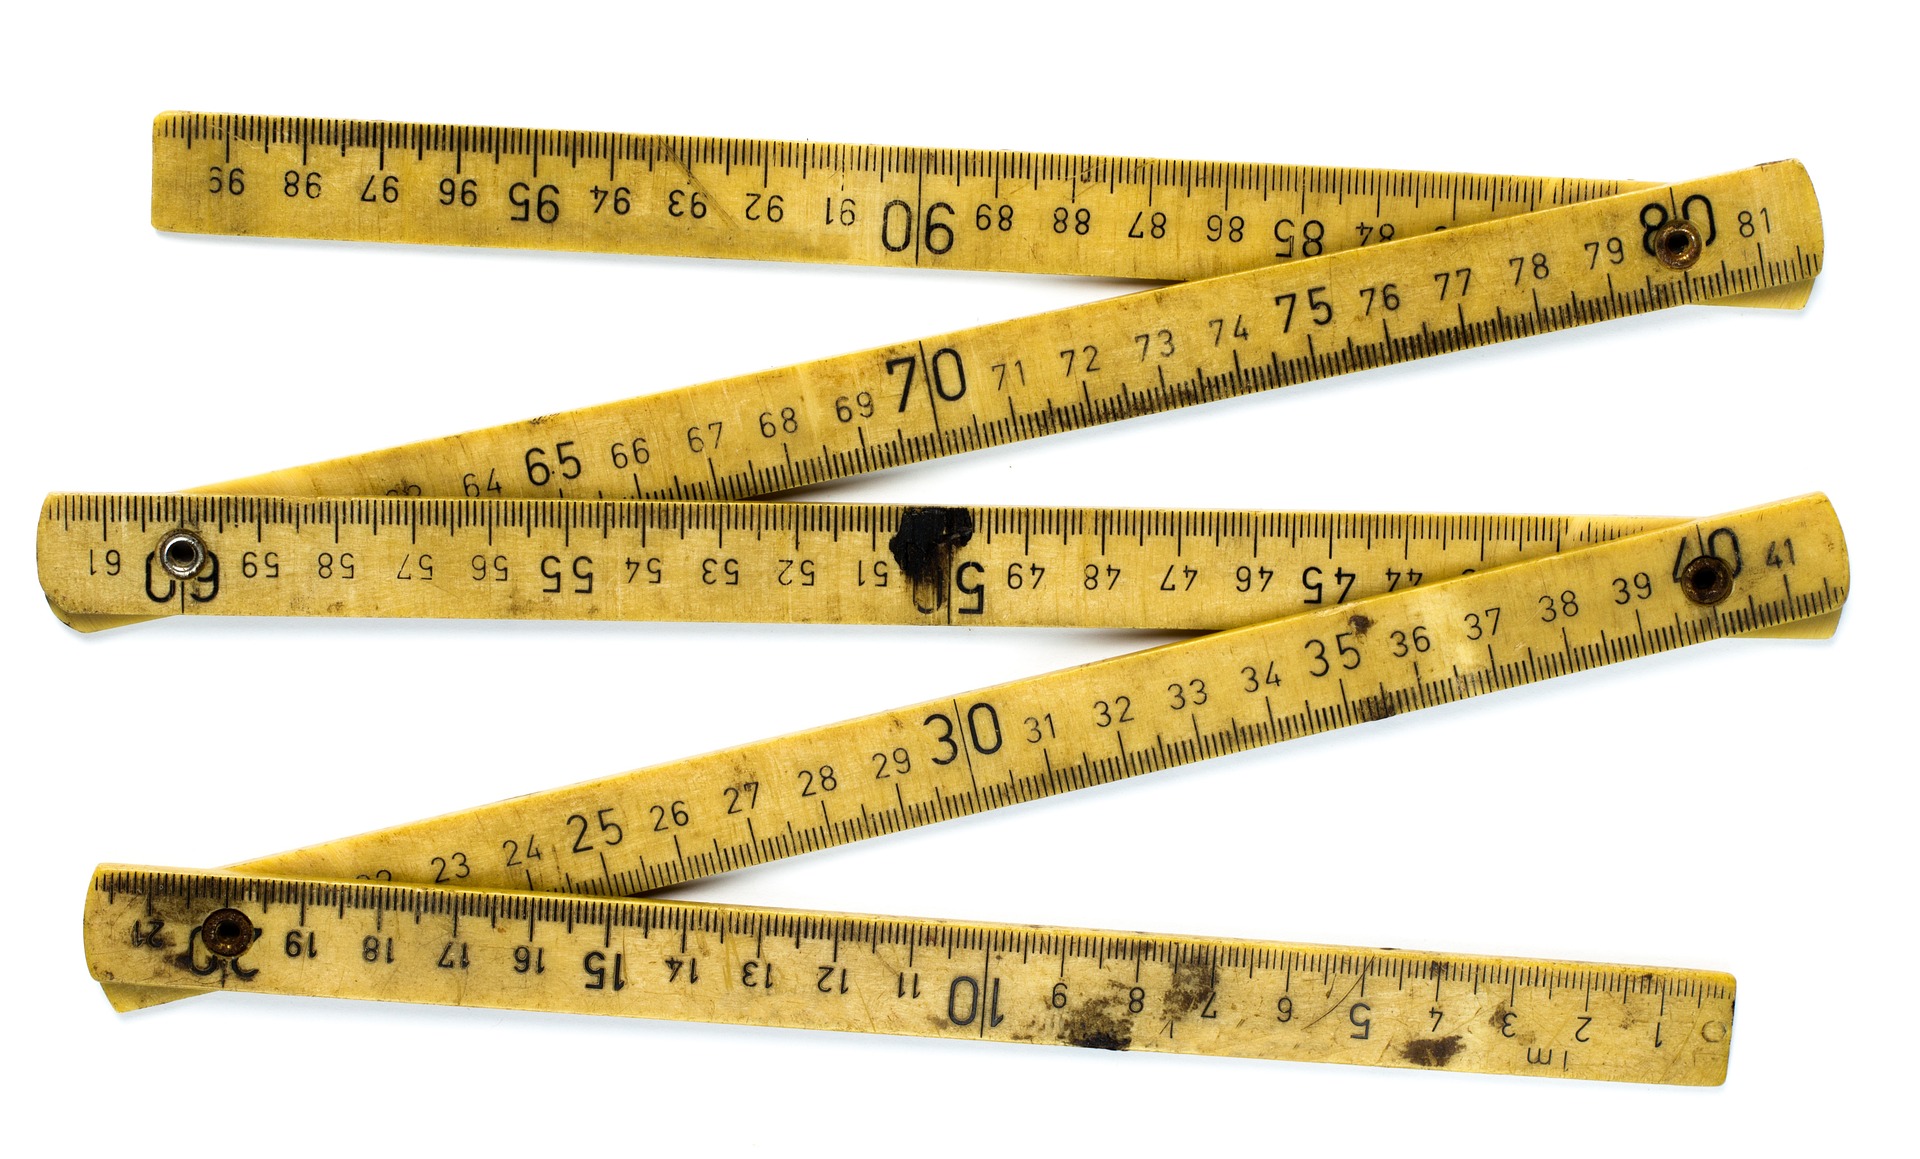 Wooden folding ruler (source: https://pixabay.com/photos/meter-rule-folding-construction-551288/, Pixabay License)
Give me the point of reference!
To work around the first challenge, you may want to create the best possible copy of the International Prototype Meter bar for your internal usage, which you could simply keep in the factory and have access to it as frequently as necessary. The copy would be most probably manufactured using different, more robust materials and – as of unit-cost - you would invest more effort in producing this than into making regular wooden rulers for your customers. You would like it to be not only perfectly accurate, but also durable and resistant to changing environmental conditions, such as temperature. One day, you could start calling your bar copy ground truth, since this would be the ultimate reference for quality checks of your wooden products.
Can I compare accurately?
Still you would have to face the second challenge: how to make sure that the procedure of comparing wooden rulers to the ground truth always runs in the same way and does not introduce any additional errors. If you would ask one of your employees to compare each produced wooden ruler to the ground truth simply by means of hands and eyes, you could possibly not trust this too much. Hands are shaky, eyes can easily omit tiny differences, humans get tired… You would start to automate the process in some way: provide stable holders for products and ground truth, equip the tester with magnifying lens, so that the matching between wooden rulers and the ground truth bar is stable and always the same. As you would scale up the production you would additionally realize, that you are not able to quality check each single product and you need to apply statistics to run quality checks on selected subset of all produced items. This subset could be called a sample.
Wooden rulers versus digital maps
Let’s now extend the wooden folding rulers story to modern digital maps. Many of the challenges remain the same with one significant difference: the reality changes constantly, whereas the ground truth bar for one meter will have remained the same for a very long time. As a map producer you want thus to compare your products (maps) to ground truth, which is expected to be a perfect model of reality. You will have to solve some exciting problems:
- Since the reality is constantly changing, you need to constantly update your ground truth. Think not only about a simple map with administrative borders or geographical regions, which are pretty stable, but about dynamic elements of reality, such as: the road network, traffic signs, traffic lights or even more dynamic ones such as roadworks, traffic congestions or temporary lane closures. Constant updates of ground truth are difficult and various data sources can be used for the purpose: information from road management authorities, aerial and satellite imagery, GPS locations and video data collected from end-user devices, a dedicated fleet of measurement vehicles, contributions from map user community. As you want to keep ground truth as accurate as possible, you need to use a combination of sources and provide stable and always running update process.
- Keeping ground truth always up-to-date results in high costs of producing it. The costs are typically too high to apply the same procedure to produce all your maps (imagine average people buying a highly accurate copy of the International Prototype Meter instead of simple wooden rulers, usability questions left aside). Therefore, you need to think about sampling the ground truth, so that you can apply statistics for accurately measuring the quality of end products at a reasonable cost.
- Furthermore, you won’t expect the same quality level in each of your products or product features. You may want to address various customer needs and optimize production costs for various use cases, for example by reducing a number of sources used or by reducing the update frequency. Since some reality components tend to change more quickly than the others - for example congestion versus the road network - you may apply different approaches to each map feature separately.
- In the digital world various pieces of information can reach your production pipelines in different formats. This makes combining or comparing them not straightforward. You need to convert between formats or define comparison rules. For example: a dual carriageway may be represented as a single line or as two parallel lines with one-direction traffic each.
Skills wanted!
As you see, to make it all work, we need to be proficient at programming, data science, statistics, machine learning… and, well, some UI/UX experience is also helpful to make the quality evaluation work smoothly and easily, and to provide easy to understand evaluation reports.
For better understanding, let’s have a look at a sample image of a road network around a residential area in a small city. The road network is represented by connected linear objects. Each of the linear objects can represent one out of five different road categories, from highways to local roads. In the image various categories are represented using different colors:
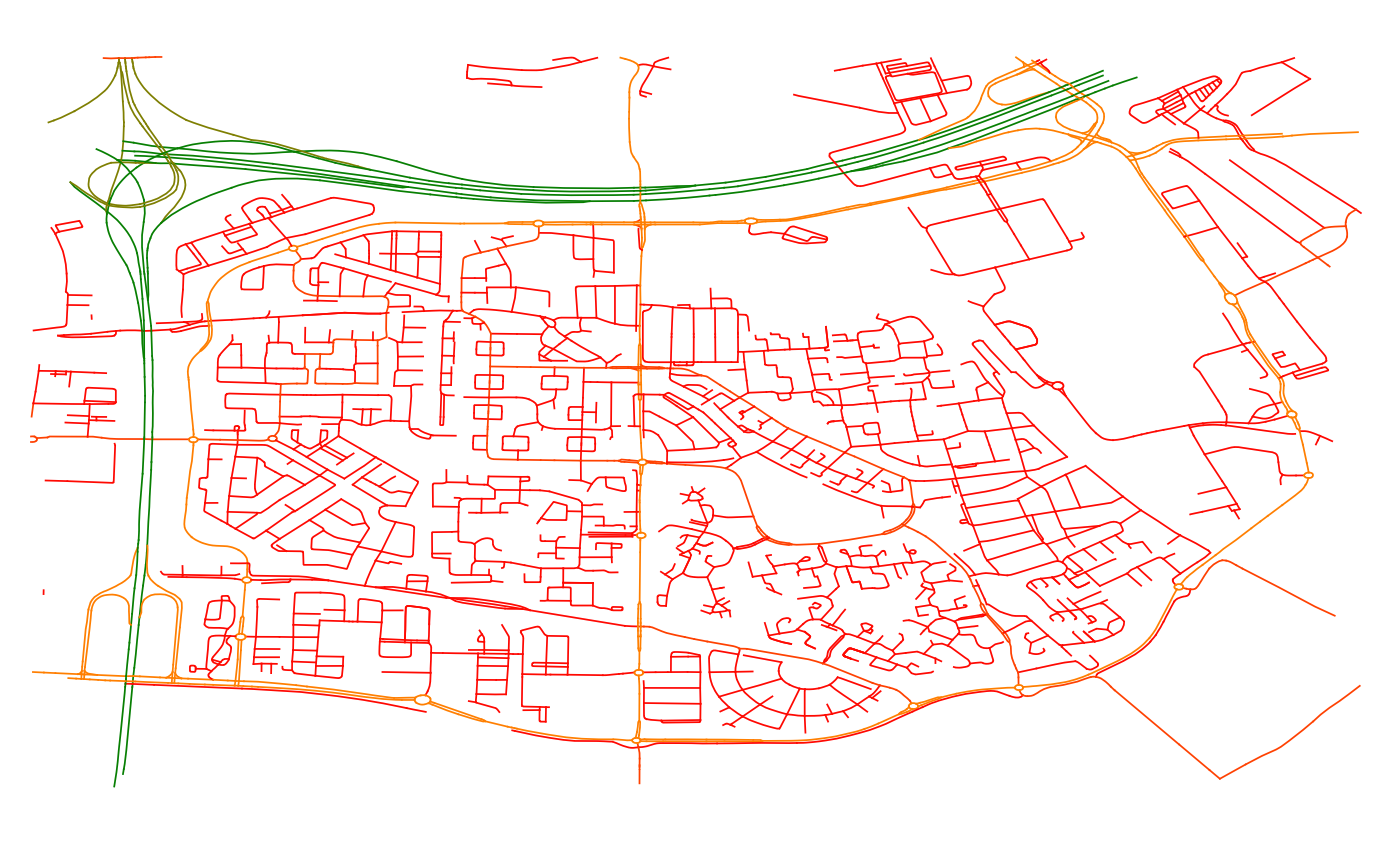 Sample map with various road categories.
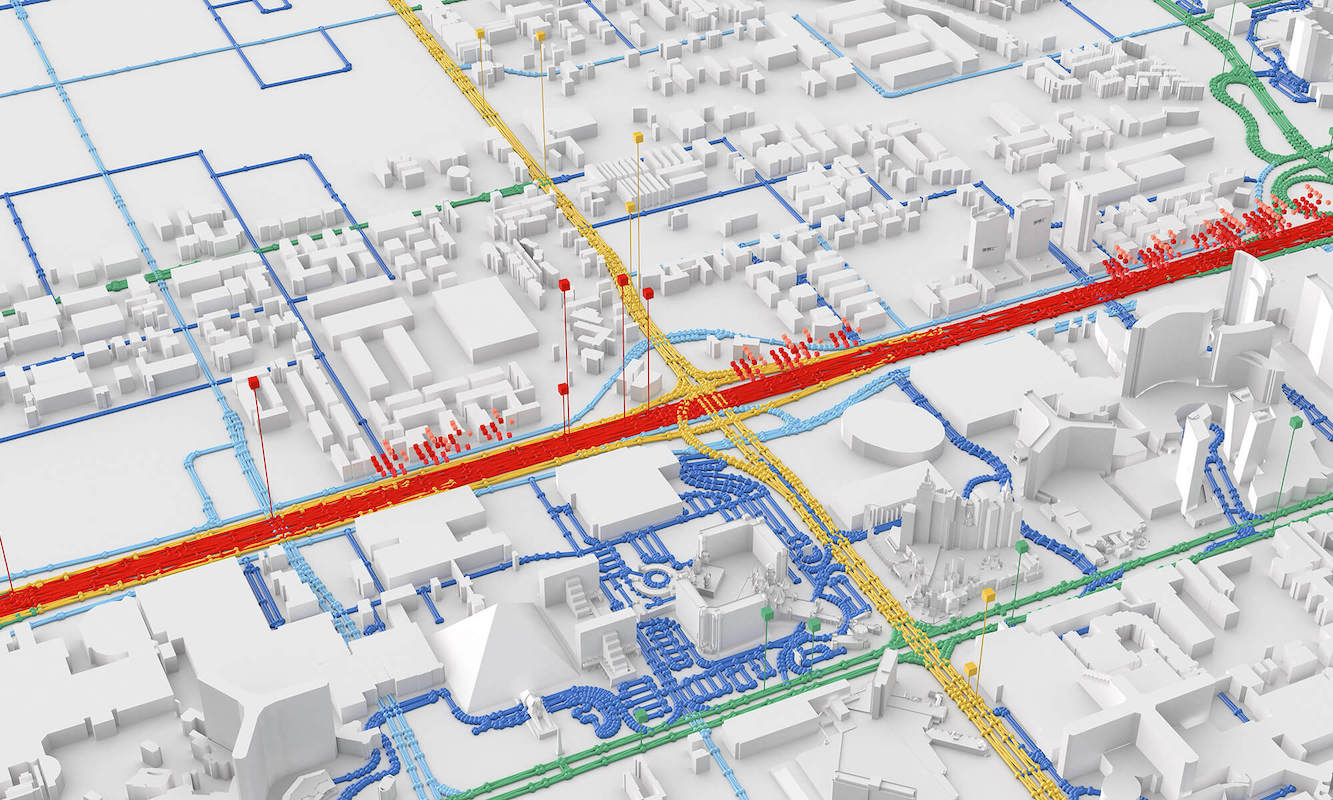
Let’s assume this is your map representation, which you would like to evaluate for its up-to-dateness. In order to do that, you requested for high quality ground truth for the same area. As you may expect, the ground truth representation is not necessarily the same as you used for the map. Road categories might be implemented differently too. This means you will not only compare geographical localization of objects in both representations – this is called positional accuracy – but also properties of the objects. You will have to answer questions similar to this: can a highway be matched with a residential area road, if they have the same geographical location? Such a situation implies that the object property is set incorrectly, even though localization is accurate. This aspect of map correctness is usually called thematic accuracy. The result of comparison between the map and the ground truth could look like this:
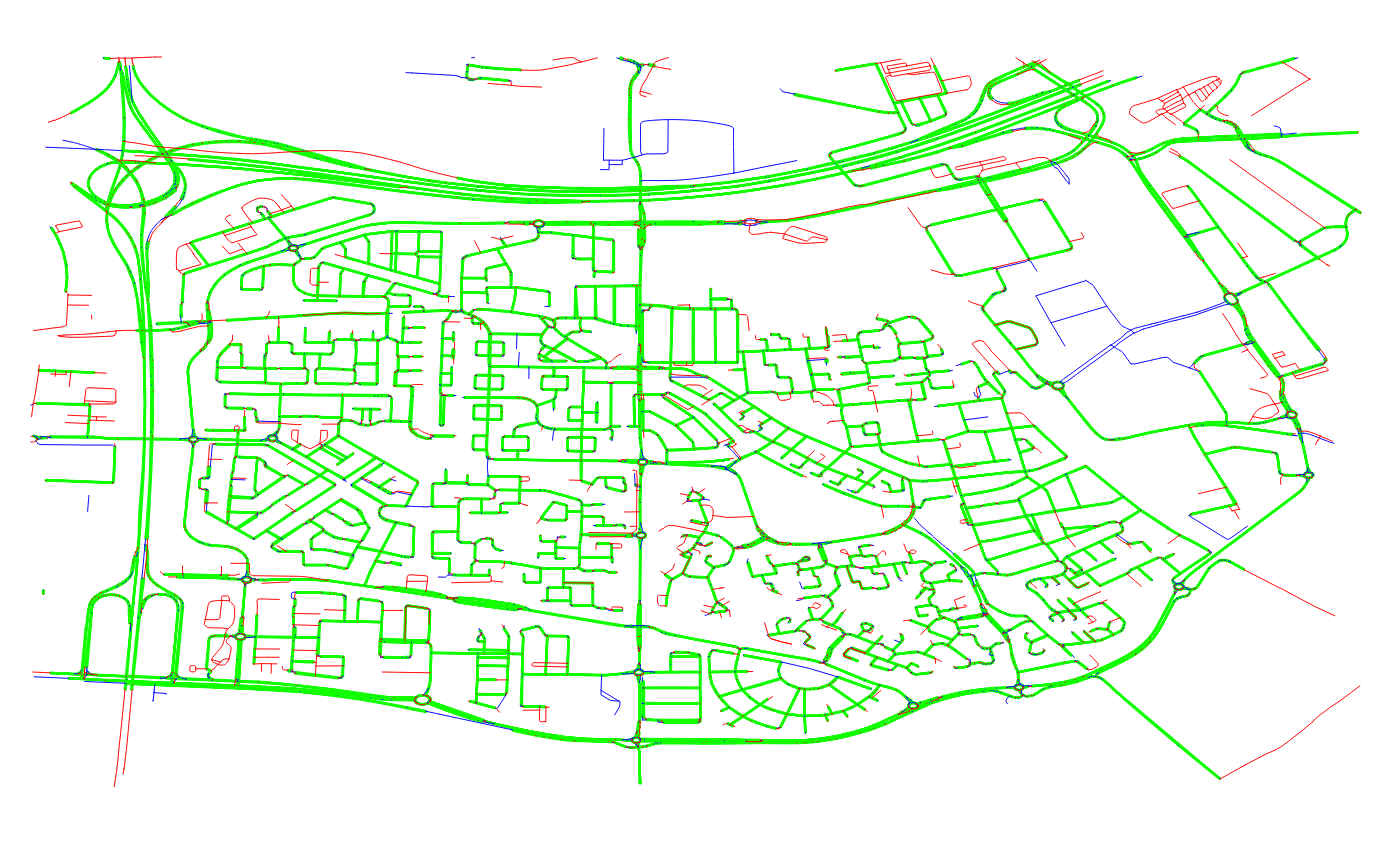 Comparison of two representations of reality. Differences in road network and road categories depicted in red and blue, respectively.
where green means there’s no conflict between your map and reality (to be precise: between map and ground truth, which represents reality), red means there are some new roads built and not yet represented in your map (the so called false negatives), and blue means there’s some thematic inaccuracy between the map and the ground truth. You could also see objects on a map, which do not exist in reality (the so called false positives). The challenges shortly described in the above example regarding linear features (road network in this case) are also valid for point features, such as traffic signs.
What if reference is not there?
In some cases this may be very hard or practically impossible to obtain good quality ground truth. In particular for innovative map features, which did not exist before and there’s no regular ground truth provided, this may be the case. In such situations you would possibly not avoid collecting initial reference data on your own, but later in the process – assuming you cannot recollect reference data frequently and effectively – you would need another approach to obtain quality insights without having access to high quality ground truth. Such an approach could consist of:
- Comparing your map to other existing maps. You know both maps contain errors, but you assume the errors are of different nature. Challenge: calculation of relevant statistical quality measures for the situation, when you do not really know what the map errors were.
- Monitoring data distribution in your product and thus estimating the confidence level of the end product features. Challenge: this is easily applicable for monitoring stability of the production process, but how to extend the approach to detect changes in reality?
- Comparing your map features to indirect ground truth, for example: traffic signs have some predefined size and proportions, curves on highways can not be too sharp, etc. Challenge: obtaining and keeping indirect ground truth data up-to-date is not necessarily easy and can usually be applied to subsets of your map features only.
In this article, we mentioned only a few aspects of quality measurement and monitoring in the context of digital map production. Each of them hides many science and engineering challenges, which are addressed by TomTom teams in their everyday work. Would you like to learn more and work on these challenges together with us? Have a look at TomTom Careers!
 Welcome to the TomTom Engineering Blog!