OpenTelemetry - Simplifying Observability
Introduction
As most companies with engineering teams will be familiar with, there are many tools and vendors available and used when it comes to observability of systems. This comes with advantages, but also disadvantages such as managing multiple user accounts, switching between user interfaces and ultimately raising cognitive load. This is something we’d like to avoid, especially during critical incidents where time and focus really matter.
Furthermore, in previous years we have observed that switching between vendors, influenced by considerations such as pricing, the introduction of new features, and performance, has proven to be more time-consuming than our ideal preference. Most of the effort involved asking multiple teams to redeploy all applications using a new vendor agent, and in some cases even making changes to their code. We believe that engineering teams should be able to focus on feature development and (code) improvements, rather than spending excessive time on switching vendors or tools. At the same time, we would like to maintain our flexibility (vendor independence).
Therefore, by the end of 2023, TomTom conducted a Proof of Concept (PoC). During this initiative, we aimed to minimize the disadvantages encountered and explore ways to simplify observability (tooling) across our systems. This effort also involved incorporating vendor-neutral technology to facilitate seamless data export and enable swift Software as a Service (SaaS) transitions. A tool we found that most aligned with our wishes and vision was OpenTelemetry.
In the remainder of this blog post, we will provide some background on OpenTelemetry, explain what and how we implemented it in our PoC using an “OpenTelemetry service” and what more benefits OpenTelemetry can bring.
OpenTelemetry 101
OpenTelemetry has broad industry support. We can see that by the increased backing from SaaS vendors. Their support indicates that the industry is aligning with OpenTelemetry and recognizing it as a future standard for application telemetry data. The enthusiasm for this project is also backed up by looking at the popularity of it at CNCF. As of today it is the second largest CNCF project, with only Kubernetes being larger.
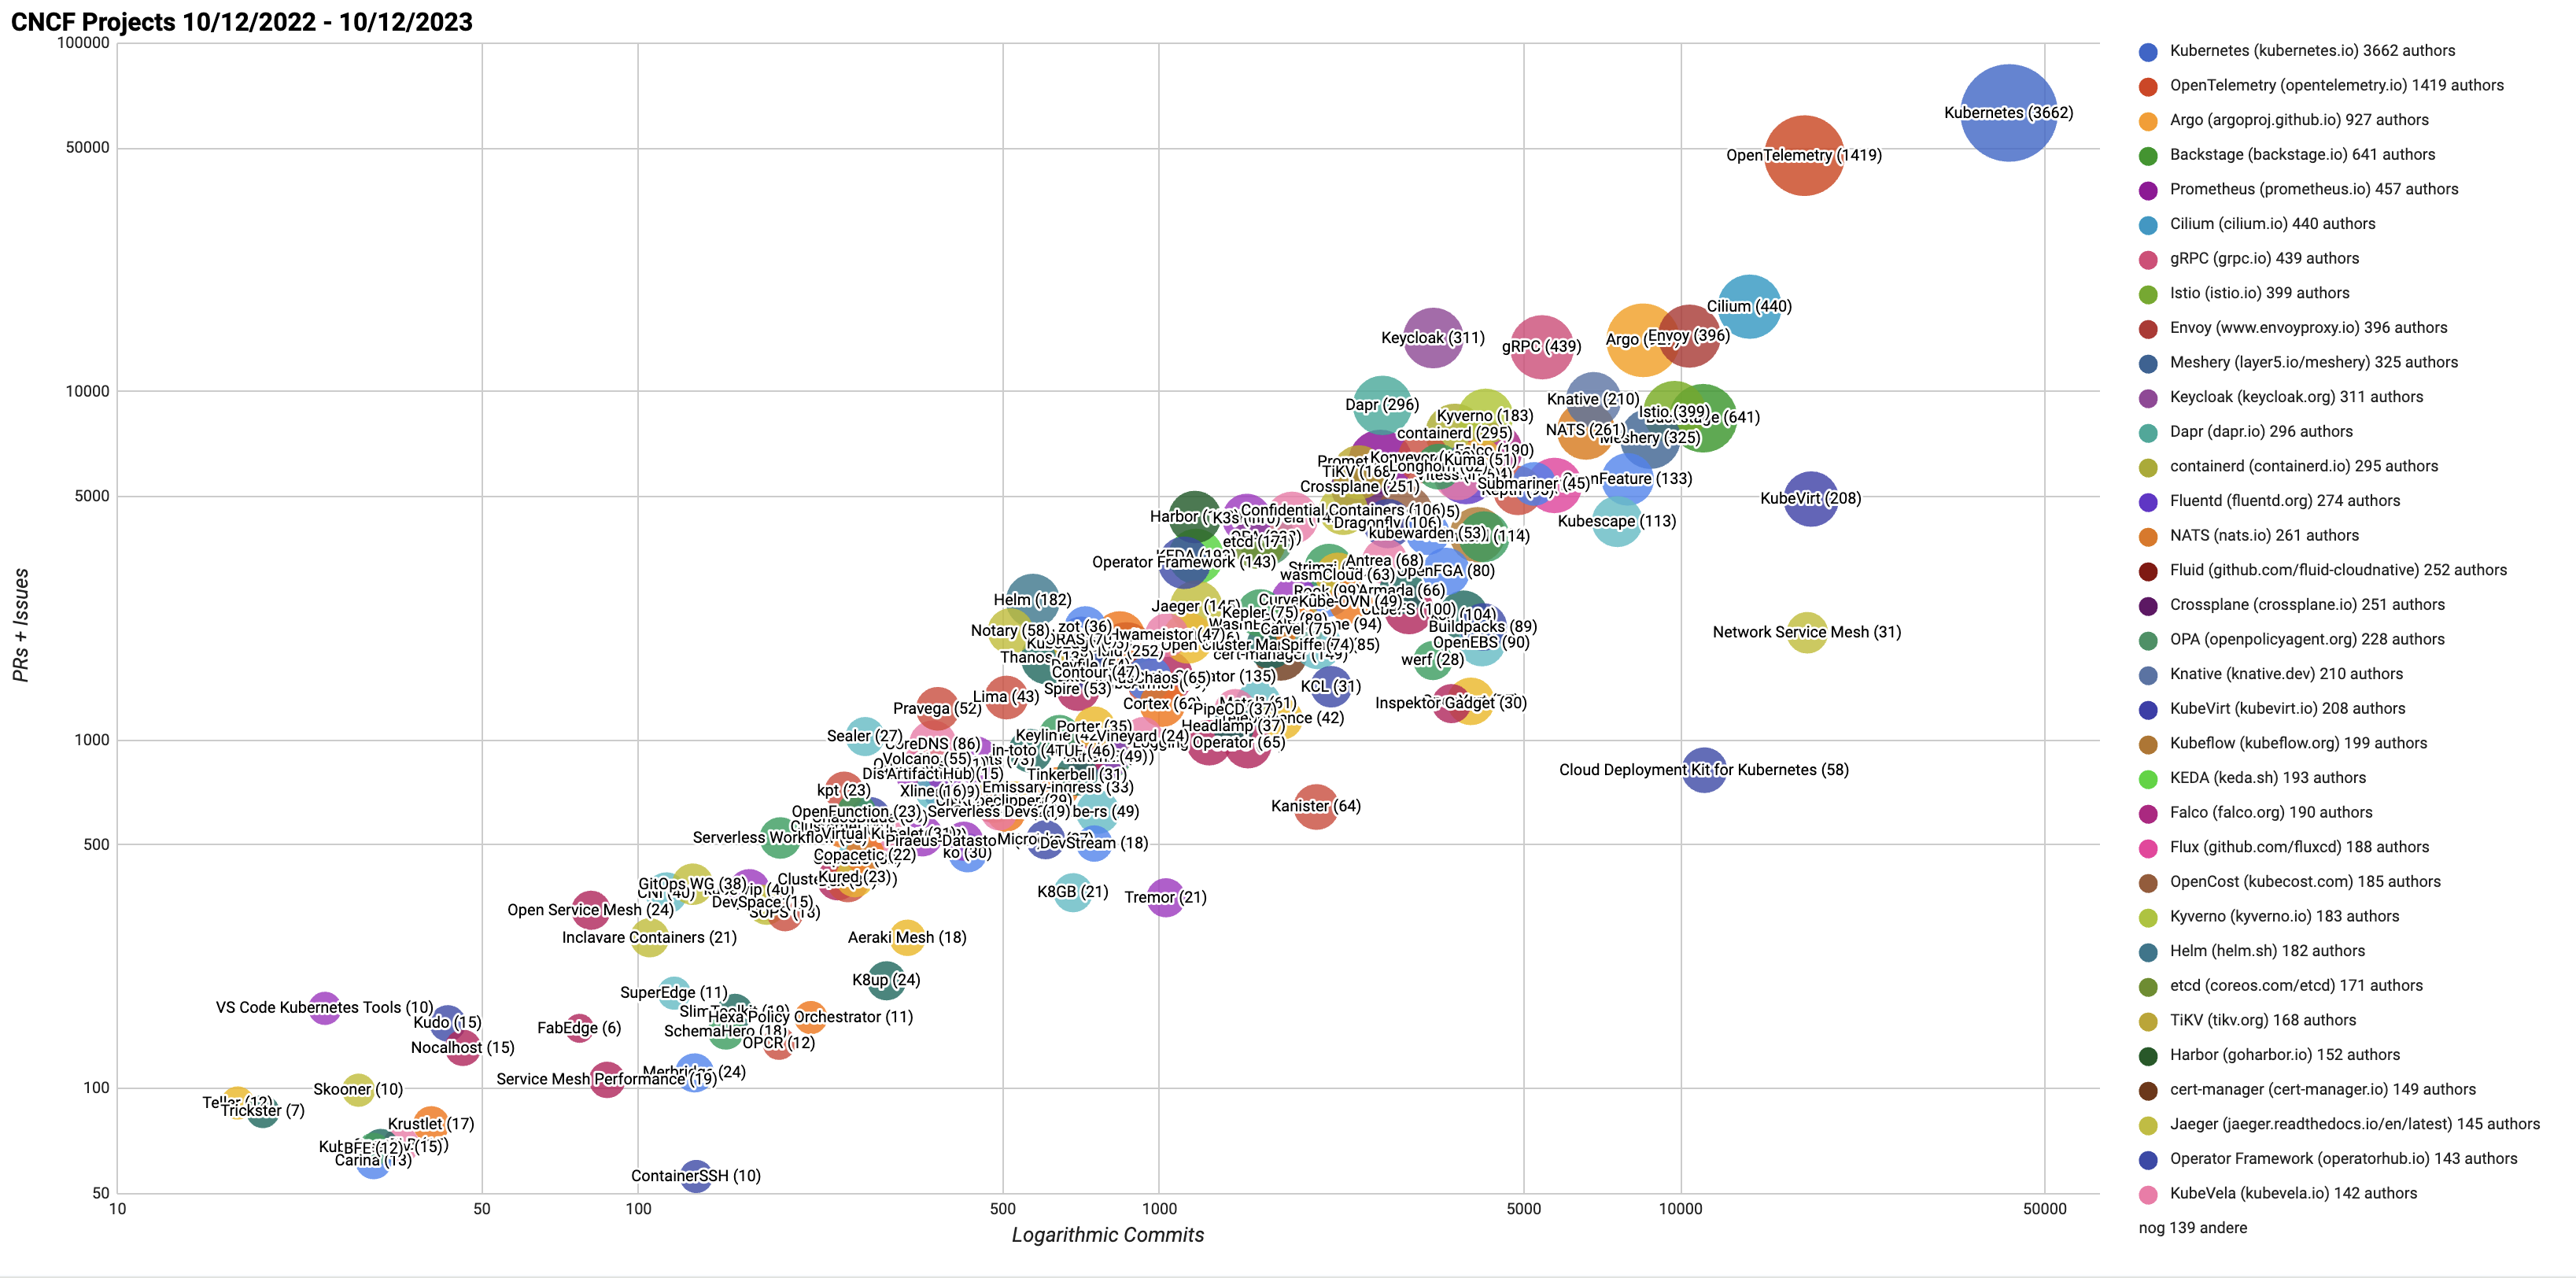 CNCF OpenTelemetry – Demonstrating OpenTelemetry’s significant presence and support within the CNCF community.
OpenTelemetry is comprised of various projects, each serving specific roles in the telemetry data collection process. The specification status, such as traces, metrics and logs, may have differing status levels. For instance, while the trace signal for Java could be stable, the log signal might still be in an experimental phase. The current status of each specification can be found here.
OpenTelemetry also provides different repositories, with the main ones being the core repository including language instrumentation libraries, APIs, and SDKs, and the contrib repository containing vendor-specific components and libraries not suited for the core repository.
The main components of OpenTelemetry are:
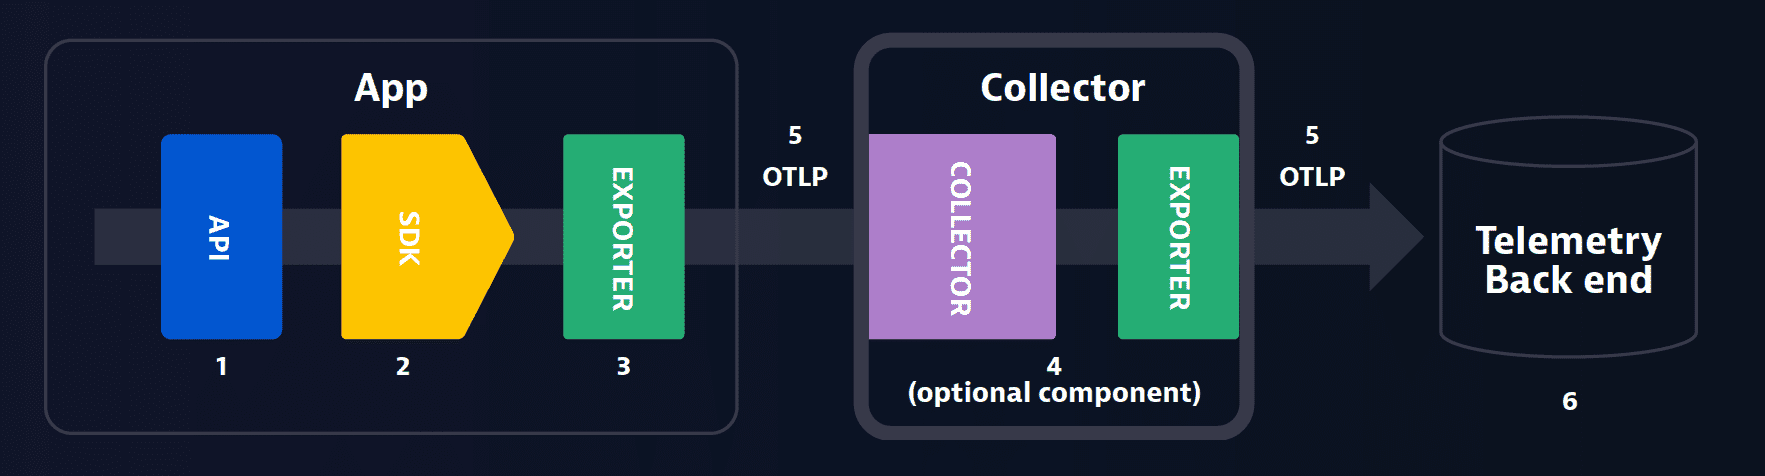
APIs and SDKs
- APIs and SDKs are used for instrumenting, generating, collecting and exporting telemetry data.
OTLP (OpenTelemetry Protocol)
- Serves as a delivery protocol.
- Operates using gRPC and HTTP/2.
- Facilitates the exchange of data between the instrumented application, collector and the backend.
Collector
- Positioned between the application and the backend, the collector is responsible for aggregating and processing telemetry data before dispatching it to the backend.
Backend
- The backend is tasked with data storage, retrieval and visualization.
- Notably, OpenTelemetry does not provide a native backend and requires integration with third-party tools for these functions.
- Examples of backends are Grafana Cloud, Scalyr, Datadog, Lightstep, Honeycomb, Signoz and more.
The OpenTelemetry Collector
The OpenTelemetry collector is responsible for receiving, processing, and exporting telemetry data, allowing for efficient data management and routing. By facilitating the flow of telemetry data between the instrumented applications and the designated backends, we can see that the collector plays pivotal role as it acts as a central hub for data management.
Here is a common setup which includes receivers, processors and exporters.
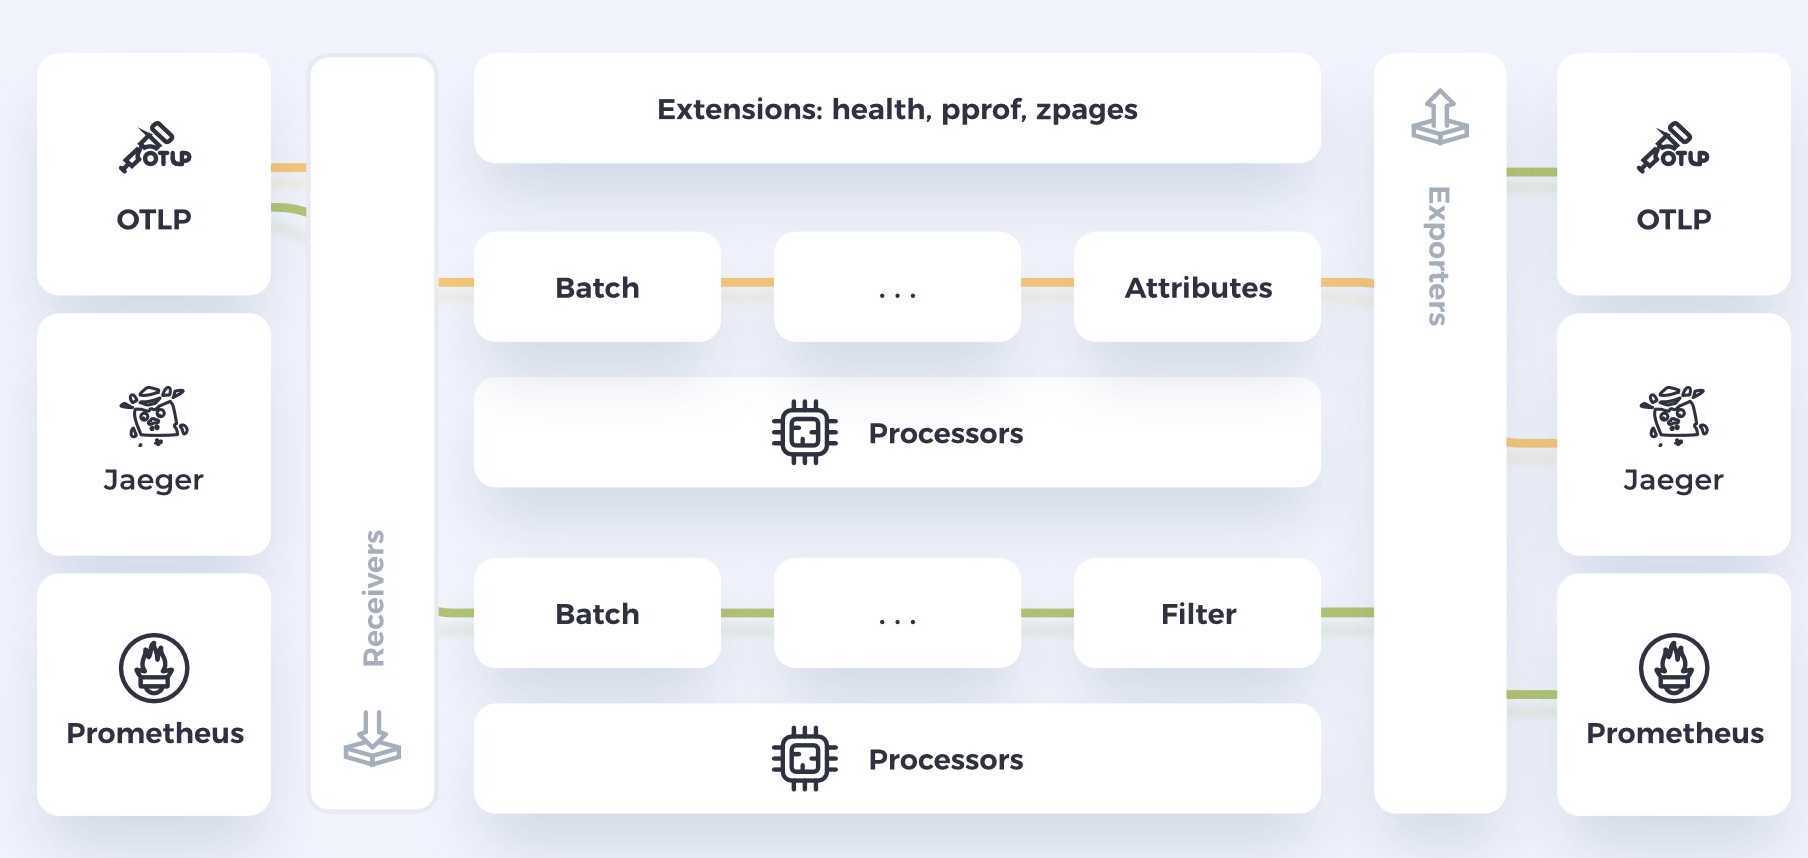
The setup is built like a pipeline.
The key components of OpenTelemetry collector include:
Receivers
On the first stage of the pipeline, we have the Receivers. Receivers can handle data in multiple protocols, including Prometheus (collects and stores time series data), Jaeger (used for distributed tracing to track user requests) and OTLP (described above).
As an example, if your code emits metrics in Prometheus, you plug in the prometheus receiver.
If your code emits traces in Jaeger, you can plug in the Jaeger receiver, and if you want to receive logs from your systems, you can plug in the filelog receiver
There are almost 100 available receivers to pick from.
Processors
In the middle we have the Processors. Processors manipulate and enrich the data before exporting it to the destination. There are currently 25 processors available, offering functionalities. Some of the processors that we currently use are:
batch(for data compression),memory_limiter(for memory management),filtering(for removing unnecessary logs from pods and reducing the cardinality),resource detection(to detect information from the host), andkubernetes attributesprocessing (to automatically discovers and extracts their metadata from Kubernetes resources).
We also use a combination of the transform and attributes processors to redact sensitive data.
Exporters
At the end of the pipeline, we have the Exporters. The role of exporters is sending data to specific backends. Also, here there are nearly 50 available exporters.
Which one to choose is usually based on your backend.
For example if you want send your logs to Loki (Grafana Cloud) and to Scalyr at the same time, then you would use the lokiexporter and the datasetexporter.
How can OpenTelemetry help companies?
Now that we understand OpenTelemetry and how to send data from our application to backends, we need to consider how we obtain this data in the first place. To collect logs, one option is to use filelog receivers, which pull logs written to files. If we want to generate telemetry data directly from our applications, we can do so by either automatically or manually instrumenting them.
OpenTelemetry provides out-of-the-box support for the majority of libraries and frameworks. Telemetry data can be generated without making any code changes through auto-instrumentation. This is usually a suitable approach for teams that don’t have the necessary knowledge or time to add custom instrumentation to their applications. If we need to use more granular and something specific to TomTom, we can ask developers to make changes to the code. This makes it flexible for us to begin with.
How do we use OpenTelemetry in our PoC?
We developed an OpenTelemetry Collector Service serving as a gateway between internal TomTom customers and our SaaS platforms. It’s primary purpose is to give the for instance an observability team the flexibility to enforce governance over the stream of data as well as switching telemetry backends quickly.
Preventing senders from directly connecting to the SaaS platform allows us to:
- control the authentication (requires authentication from the Agent to the Gateway service),
- setting some general configuration for batching, encryption,
- able to enrich and manipulate the data across the collector,
- switching telemetry backends, should we need to.
To make it easier for us to know which teams send the data, we also added an owner label to each gateway instance.
The architecture consists of 2 domains with different responsibilities, an agent (owned by individual teams) and a gateway (owned by the observability team).
Observability Team Responsibilities
- Owns and operates the infrastructure for the OpenTelemetry Collector Service.
- Responsible for designing and developing the OpenTelemetry Collector gateway.
- Managing deployment instances in dedicated namespaces and ensuring the scalability and reliability of the collectors.
- Managing the ingress, which accepts and routes incoming requests to the dedicated OpenTelemetry gateway instance.
- Enforcing governance over the stream of data by configuring and managing the OpenTelemetry Collector Service to control authentication, general configurations for batching and encryption, data enrichment, and manipulation, as well as the flexibility to switch telemetry backends as necessary.
- Providing support and guidance to individual teams during the onboarding process, including educational workshops, documentation, and continuous assistance in configuring and extending the pre-configured agent to meet specific team requirements.
Individual Team Responsibilities
- Utilizing the OpenTelemetry Collector Service.
- Ensuring the deployment and operation of the OpenTelemetry Agent.
- Collaborating with the Observability Team to configure and extend the pre-configured OpenTelemetry agent, tailoring it to the specific needs of their services, including the fine-tuning of service-specific configurations such as transform processors.
- Sending telemetry data to the OpenTelemetry Collector Service through pre-configured agents, adhering to best practices and guidelines provided by the Observability Team.
- Working closely with the Observability Team to transition from existing telemetry platforms to the new OpenTelemetry-based platform, including parallel logging and eventual migration.
Onboarding Teams
We decided to start the onboarding process small and asked teams to initially only send logs from their development services. We recommended that all teams to ship logs in parallel, that is, both to the existing logs platform and to the new one. Once we verified with teams that they are comfortable that everything works, we asked them to switch off the existing platform and only use the new platform.
At all times, the Observability team stayed in close contact with the team(s) during onboarding, and continuously educate teams on OpenTelemetry, and helps them with guidelines on best practices, which are done with a combination of documentation and workshops together with teams.
Sending logs with OpenTelemetry
In the architecture diagrams below, we have an application and an OpenTelemetry agent on the left-hand side that consume the OpenTelemetry Collector Service (in the centre), which, in turn, sends the data to an OTLP-compatible backend on the right-hand side.
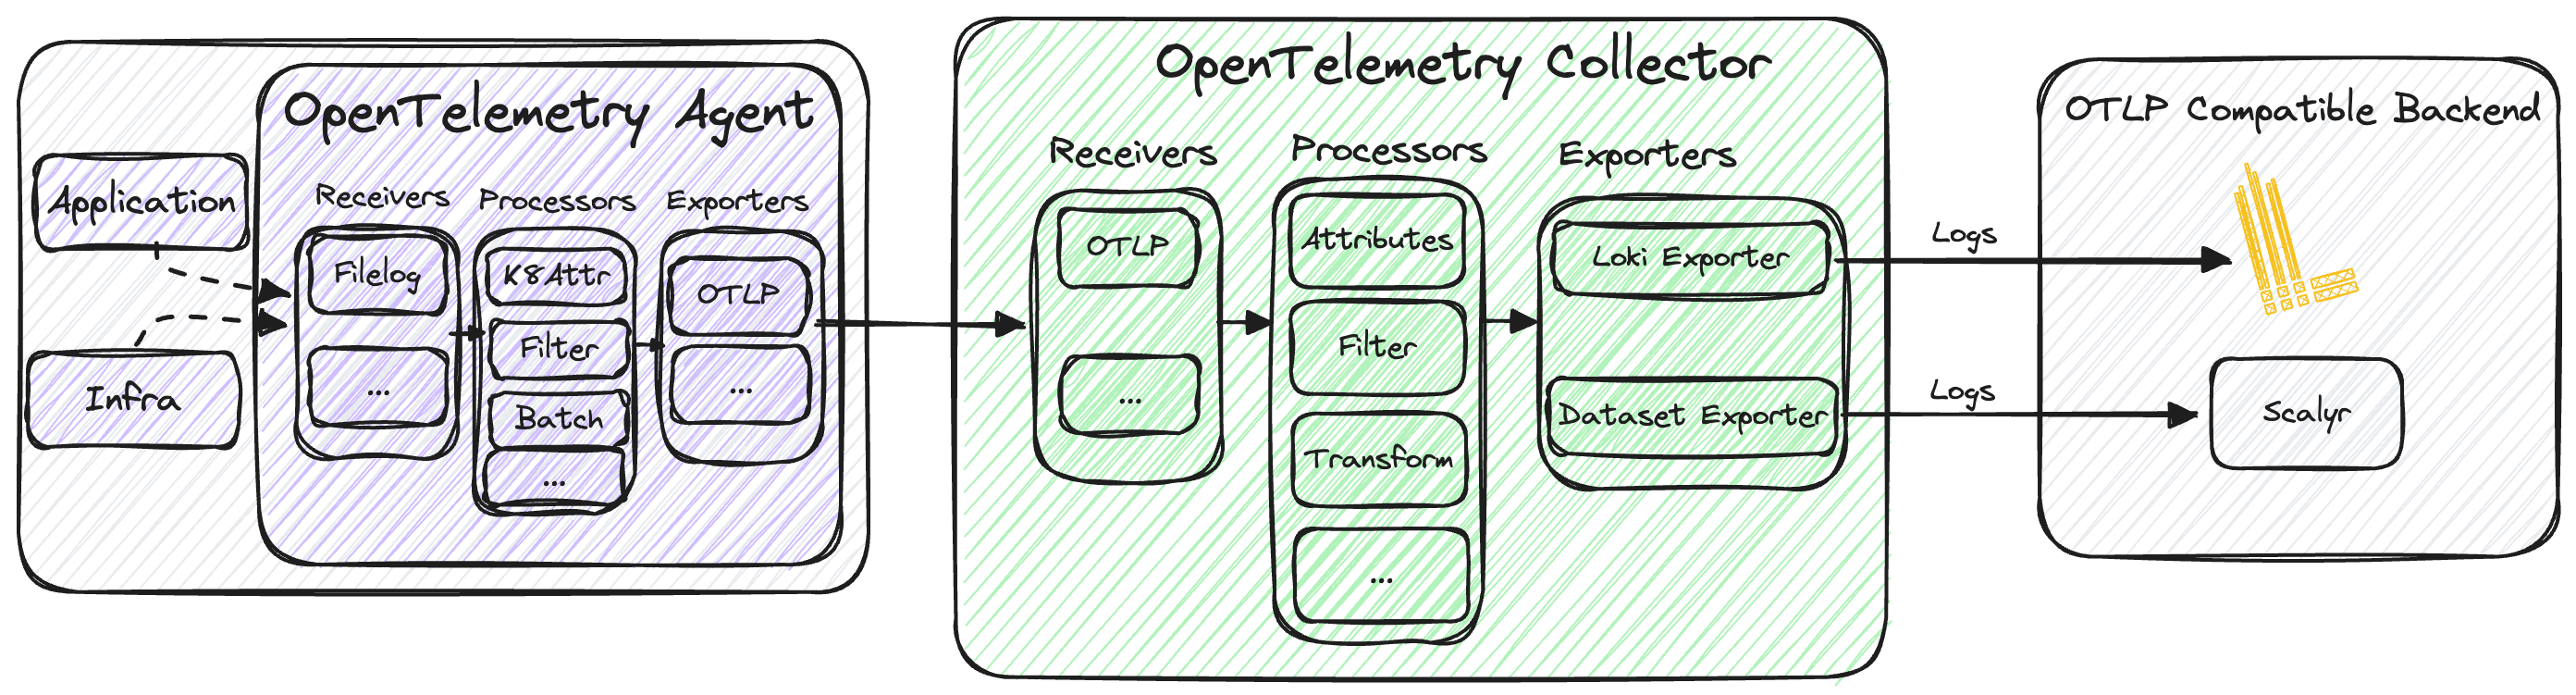
To start collecting logs from this application, we use the Filelog receiver.
The filelog receiver is usually the recommended way of collecting logs with OpenTelemetry.
Once it’s running, it will start to tail and parse logs from your system.
We then use processors to enrich and/or manipulate the data using a myriad of available processors, and then export it to a backend. In our case we added metadata with key information like an “owner” label, and a filter processor for dropping logs from different namespaces.
In this example, logs are sent to Loki and Scalyr by using the lokiexporter and datasetexporter.
Sending Metrics with OpenTelemetry
If we then would like to collect metrics, we then add the Prometheus receiver, as illustrated in the architecture diagram below.
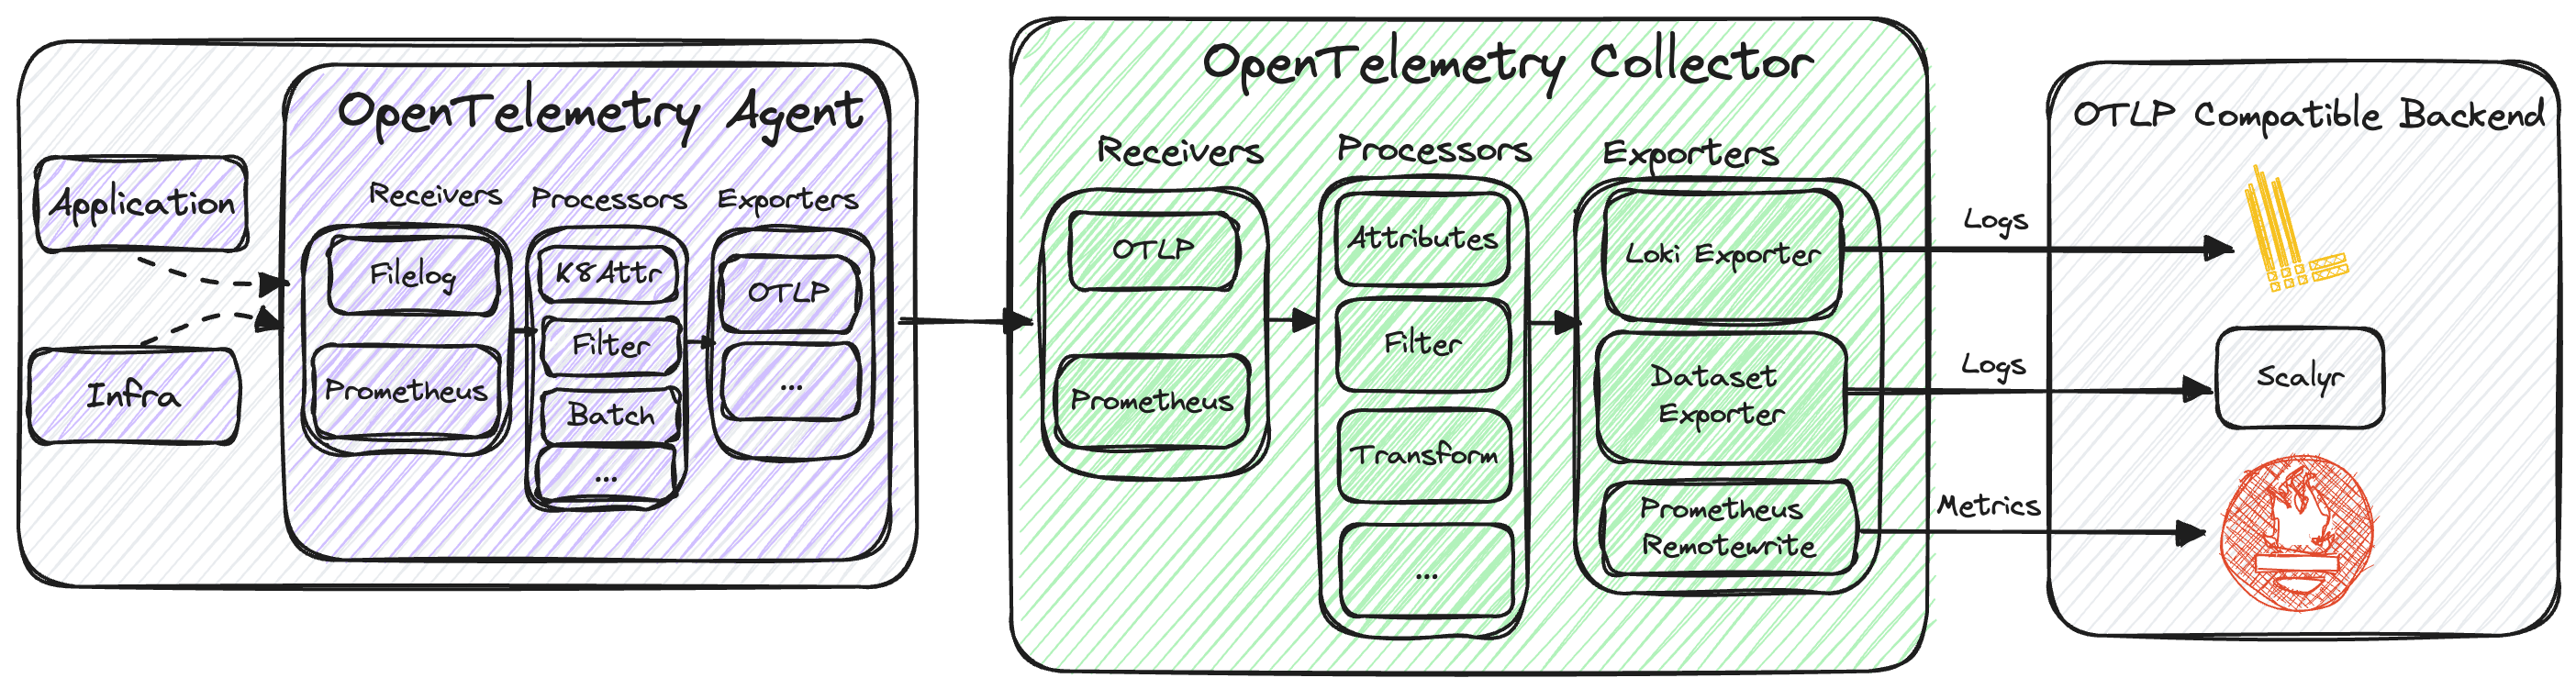
The metrics obtained can then be exported using the prometheusremotewrite exporter, enabling analysis in platforms such as Prometheus / Mimir. While our current focus is primarily on logs, the Observability team is actively preparing the collectors and agents for handling metrics as well.
Sending Traces with OpenTelemetry
To capture traces effectively, we introduce the OTLP receiver, which is exported using the OTLP exporter. This allows for analysis in backends like Tempo and / or Jaeger. If your application is instrumented with an OTEL SDK, it will emit traces and the associated spans from these requests..
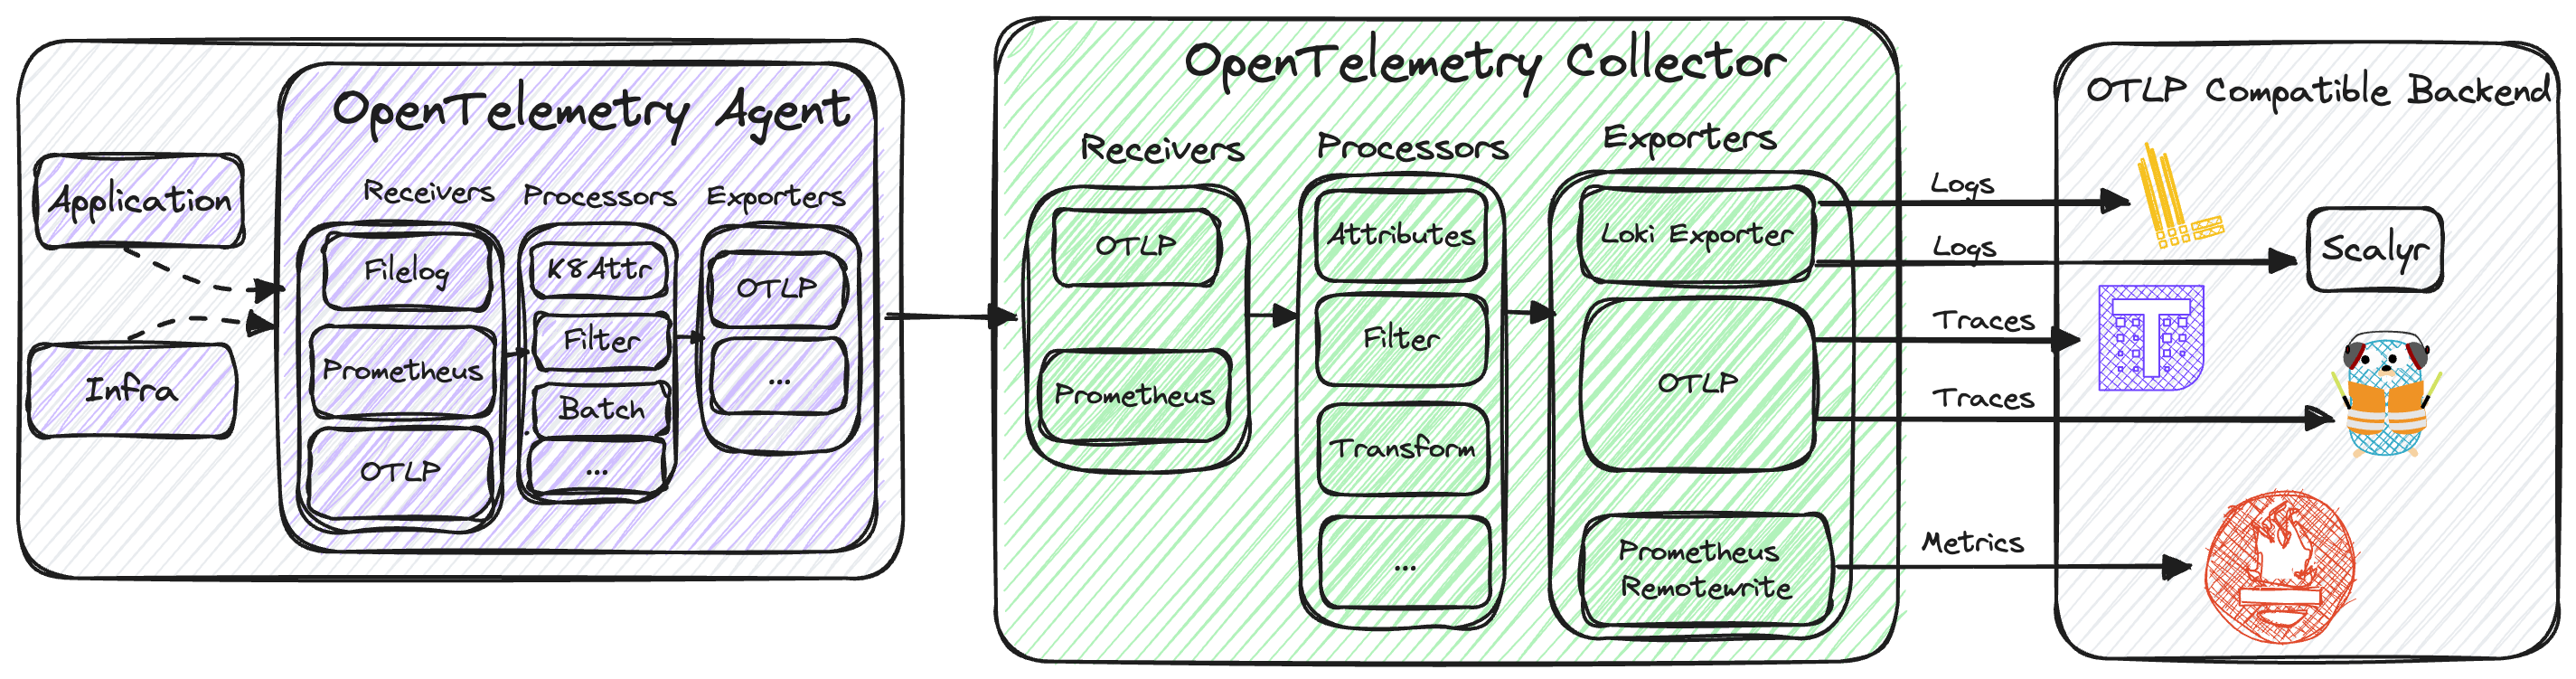
While our current emphasis is on logs, it’s important to note that the Observability team is diligently preparing the collectors and agents to seamlessly handle traces in the near future.
OpenTelemetry - Dashboard
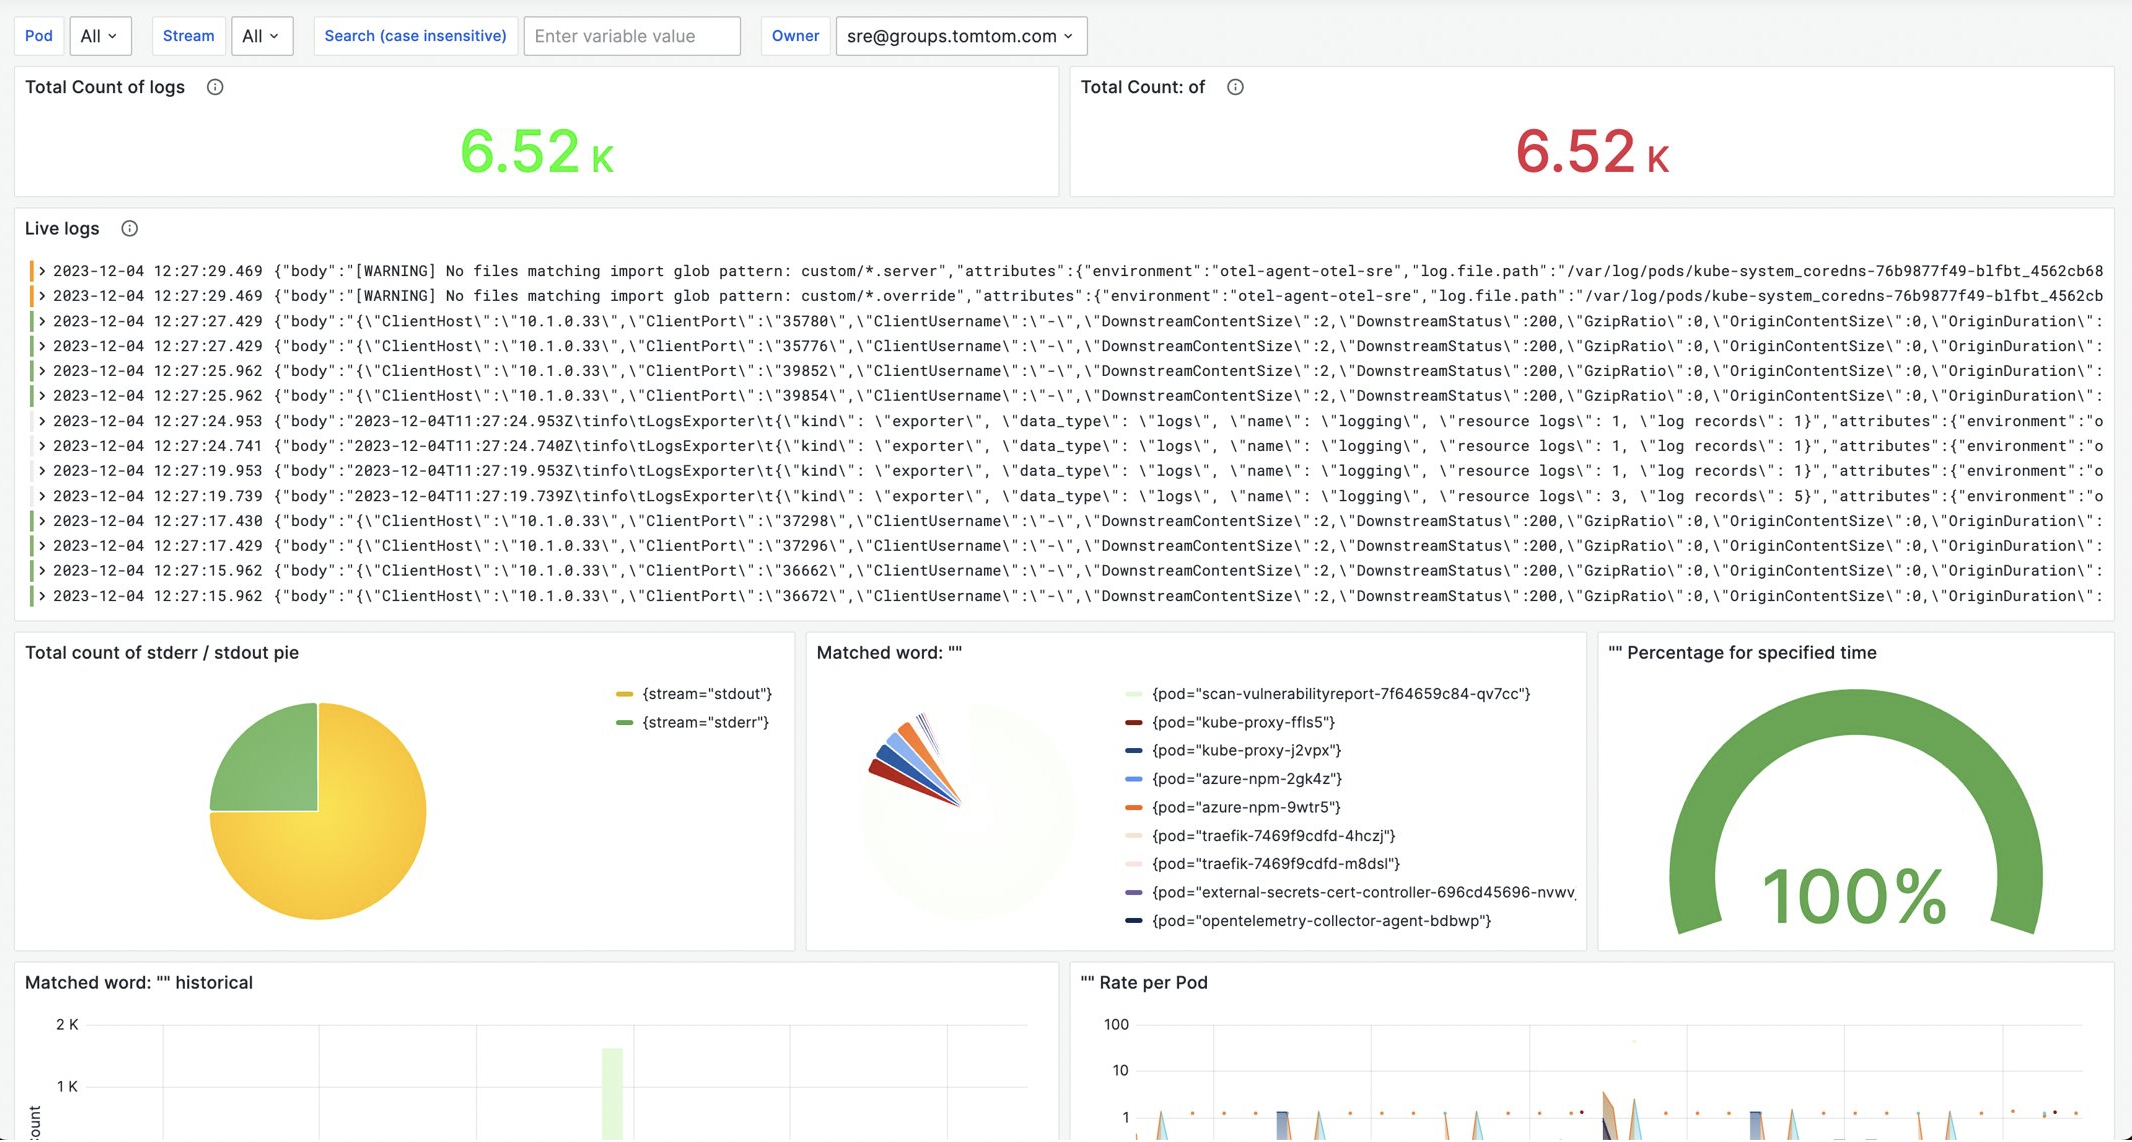
Let’s explore some dashboards to see what it looks like after OpenTelemetry is implemented.
This Grafana dashboard provides insights into the system and applications logs. We can use the owner label (added in the transform processor) to filter out the logs.
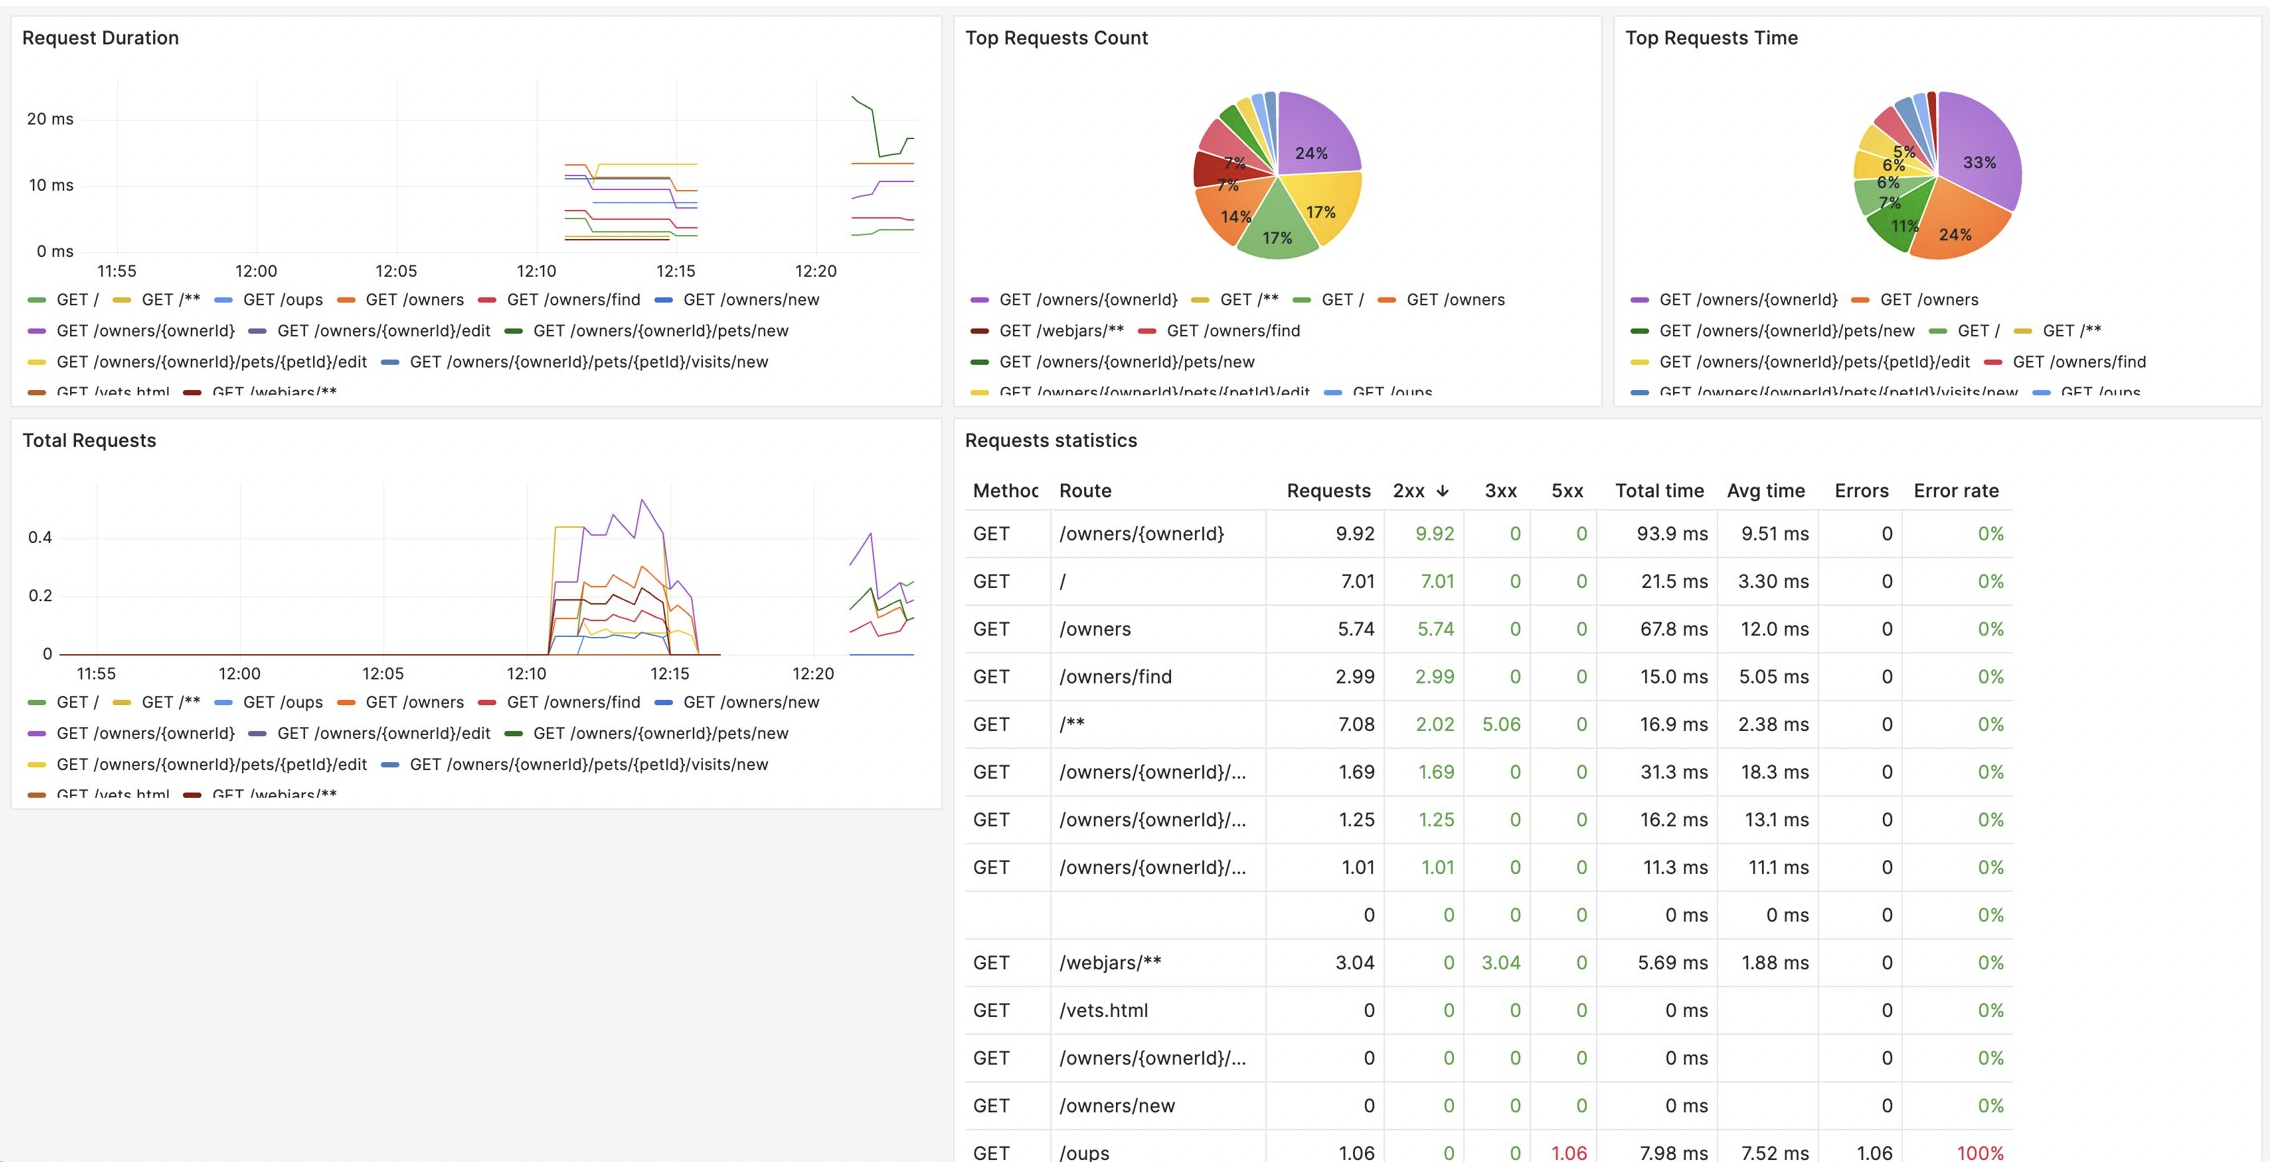
Another Grafana dashboard displays the RED (Rate, Errors, and Duration) metrics of a Spring Boot (demo) application, providing insights into the performance, reliability, and efficiency of our application.
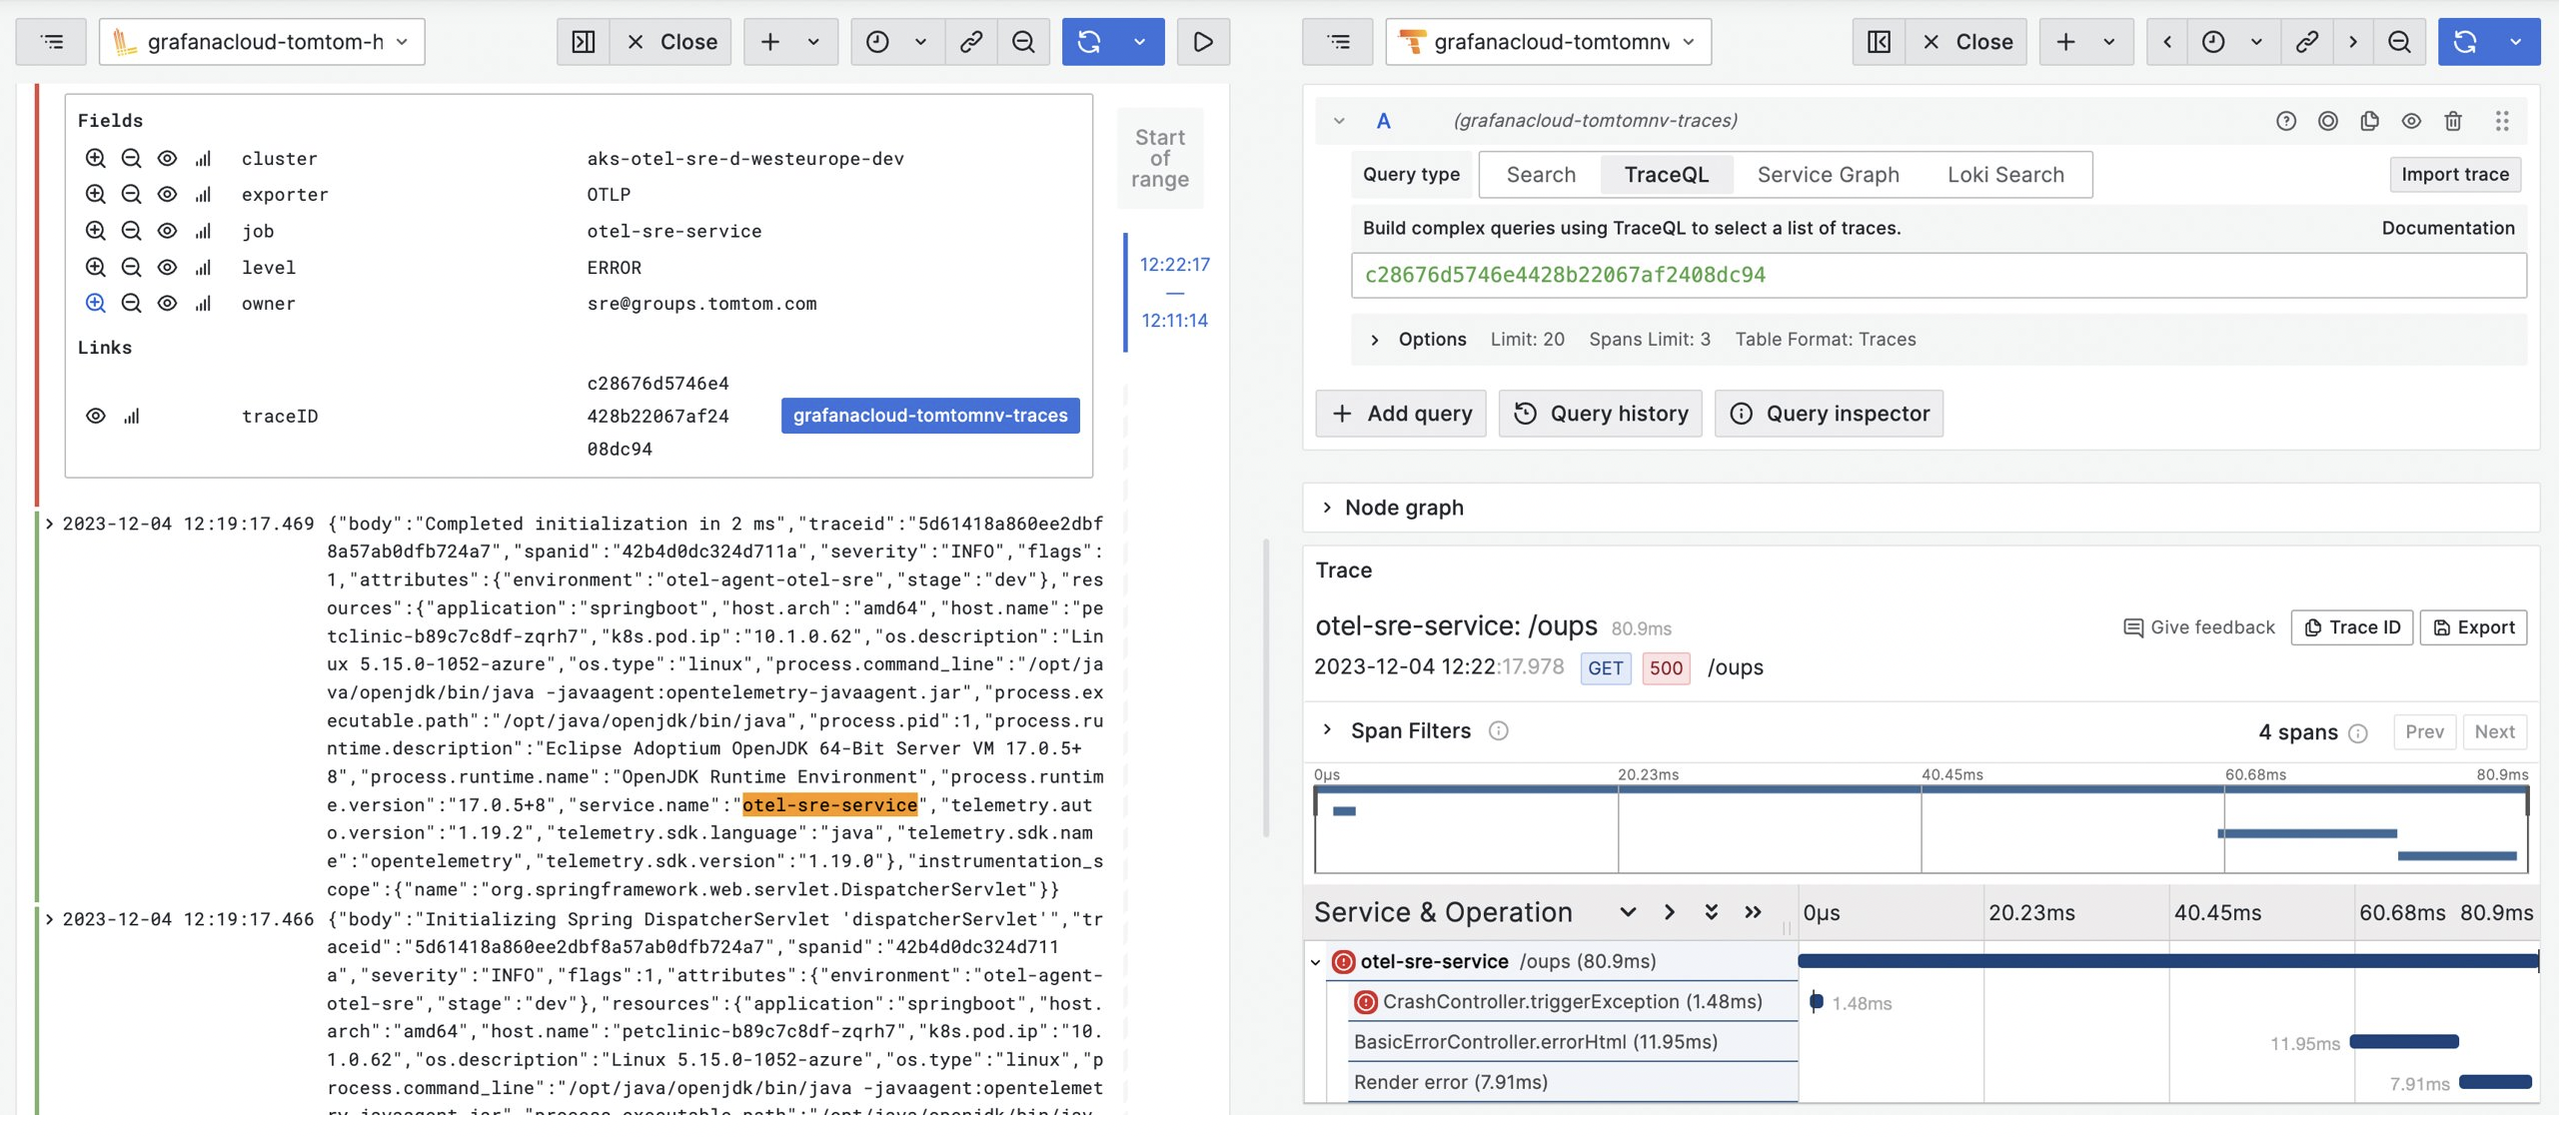
In the following dashboard, we have the ability to seamlessly transition from a log entry directly into Tempo, where you can view the unique TraceID (a unique identifier assigned to a distributed trace) associated with that specific event.
Monitoring
Monitoring OpenTelemetry resources is crucial to identify issues such as data loss, queue length, and understand the data flow, as well as to monitor infrastructure resources like CPU and memory. These metrics can reveal if the collectors are operating under ideal conditions.
A PodMonitor is deployed on the agent collector, while a ServiceMonitor is deployed on the gateway collector. All metrics from these collectors can be visualized, and essential dashboards are set up to help understand the behavior of the service.
These are examples of Grafana Dashboards that we use to monitor the OpenTelemetry collectors:
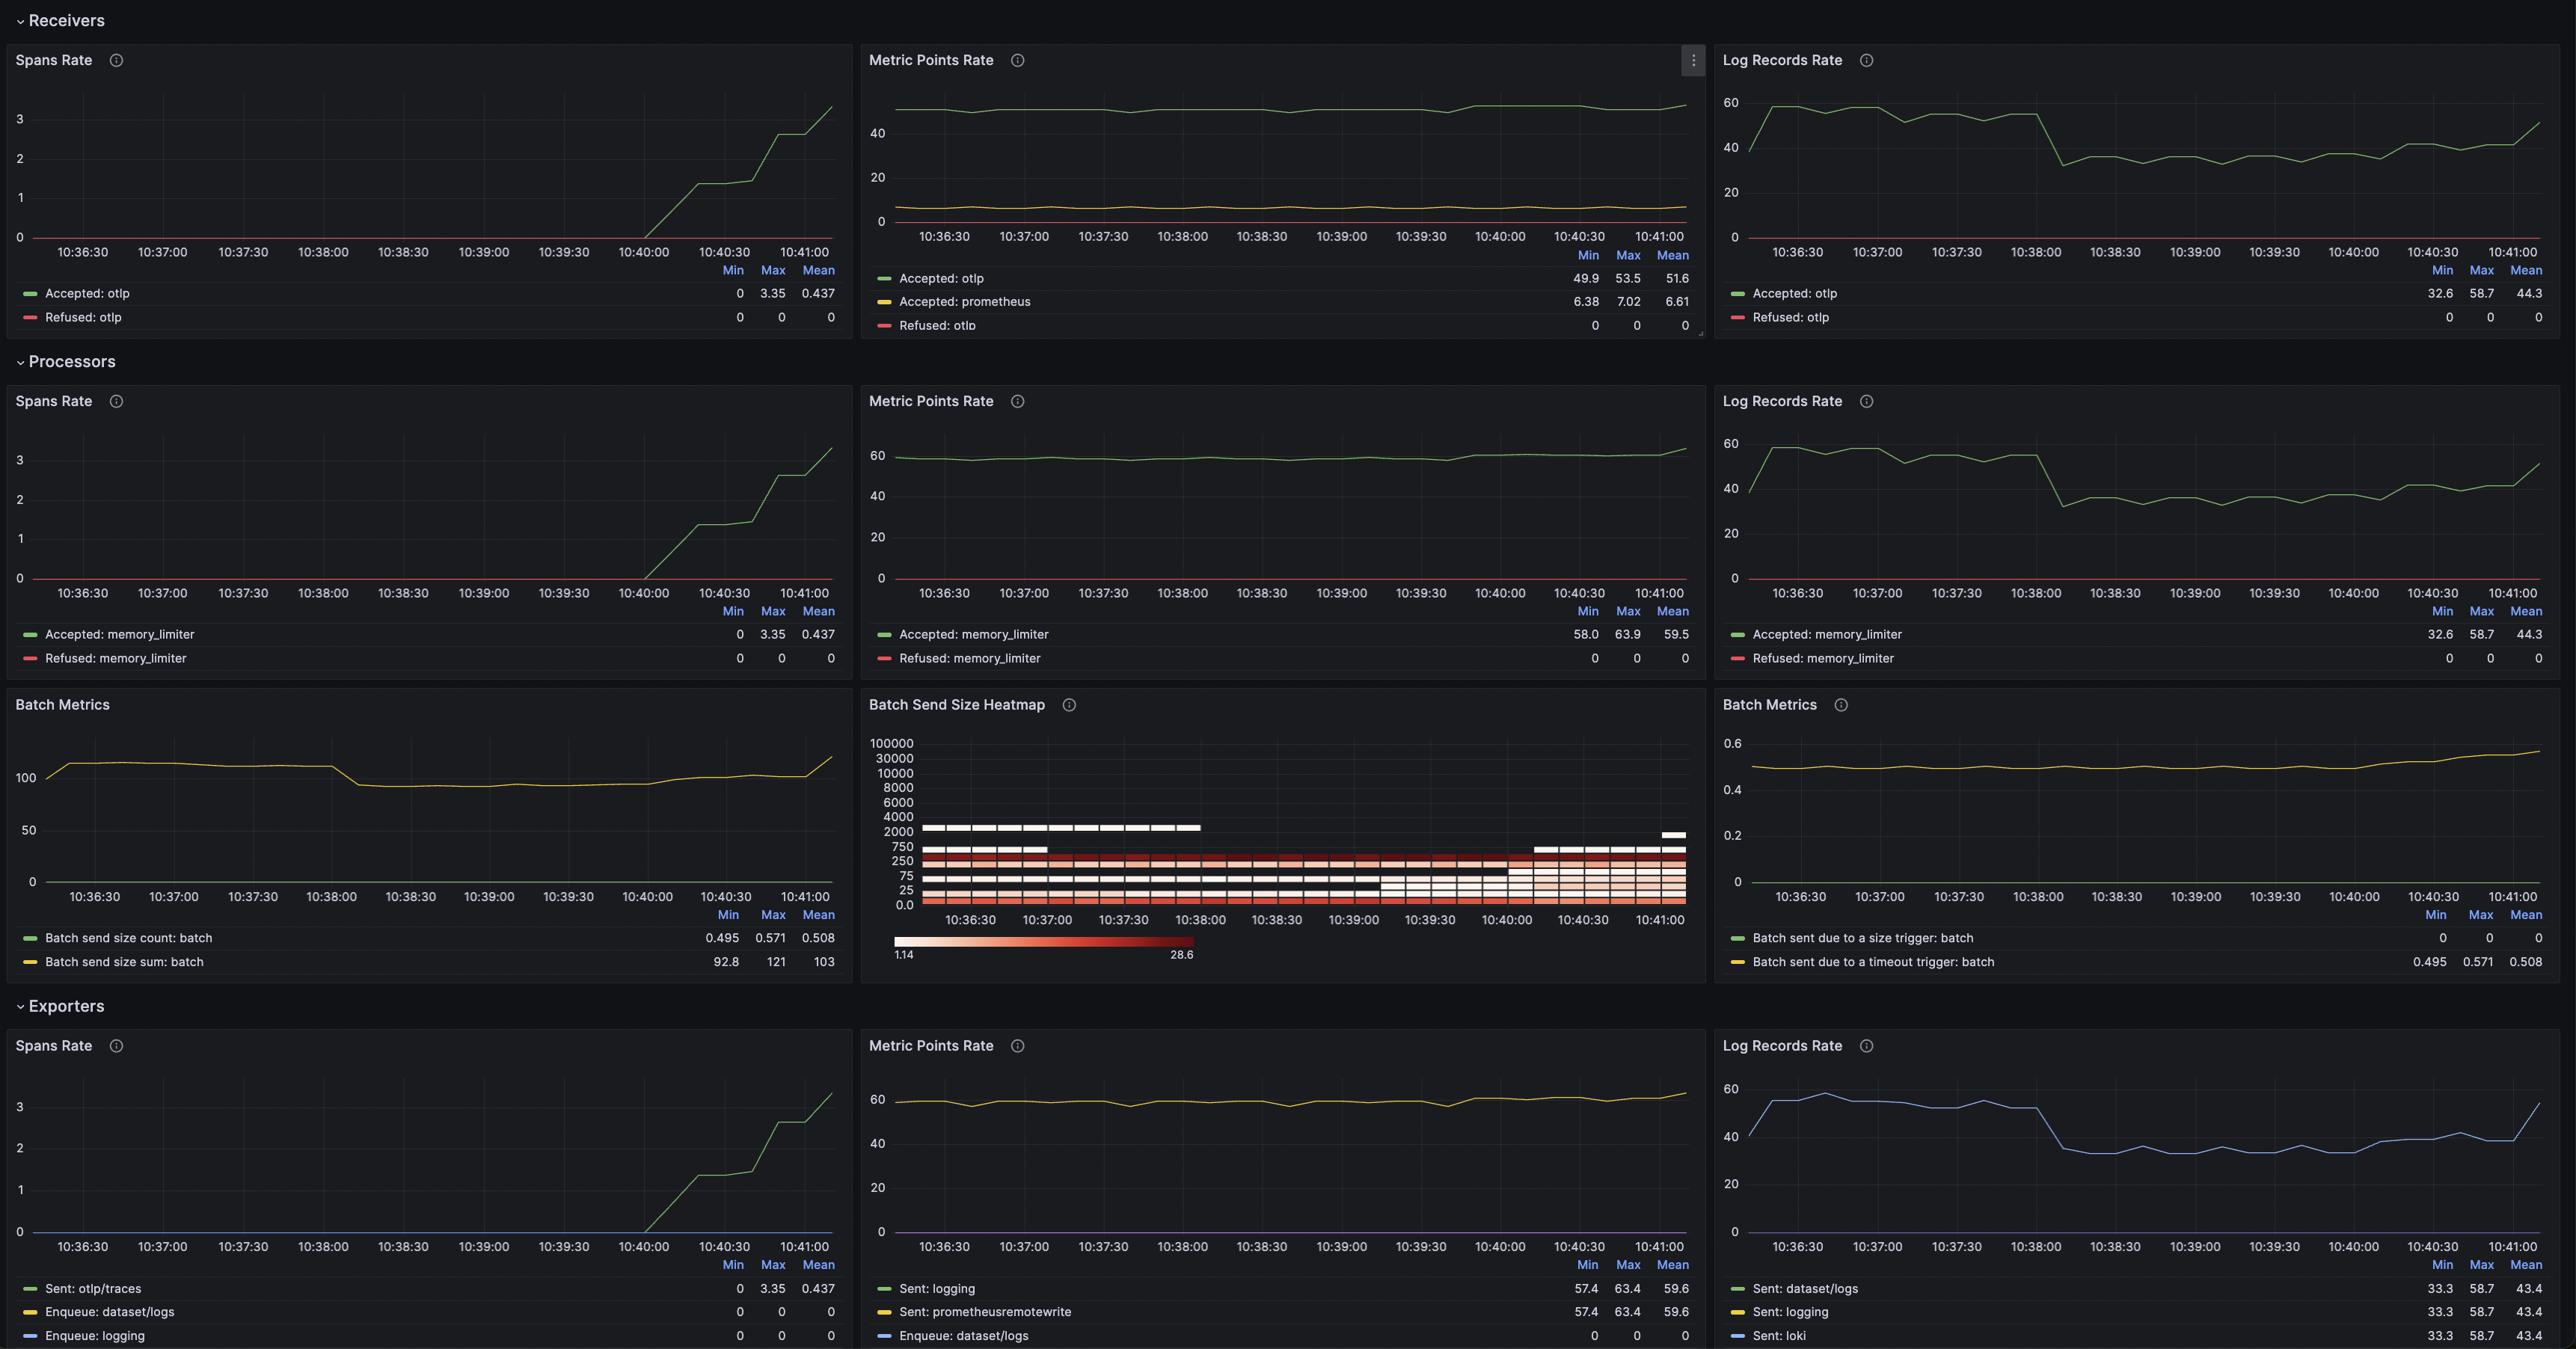
The above dashboards shows:
- Metric/Logs Rate,
- Batch Metrics/Size,
- Exporters Capacity, Queue Size,
- Collector Memory,
- Collector Uptime by instance.
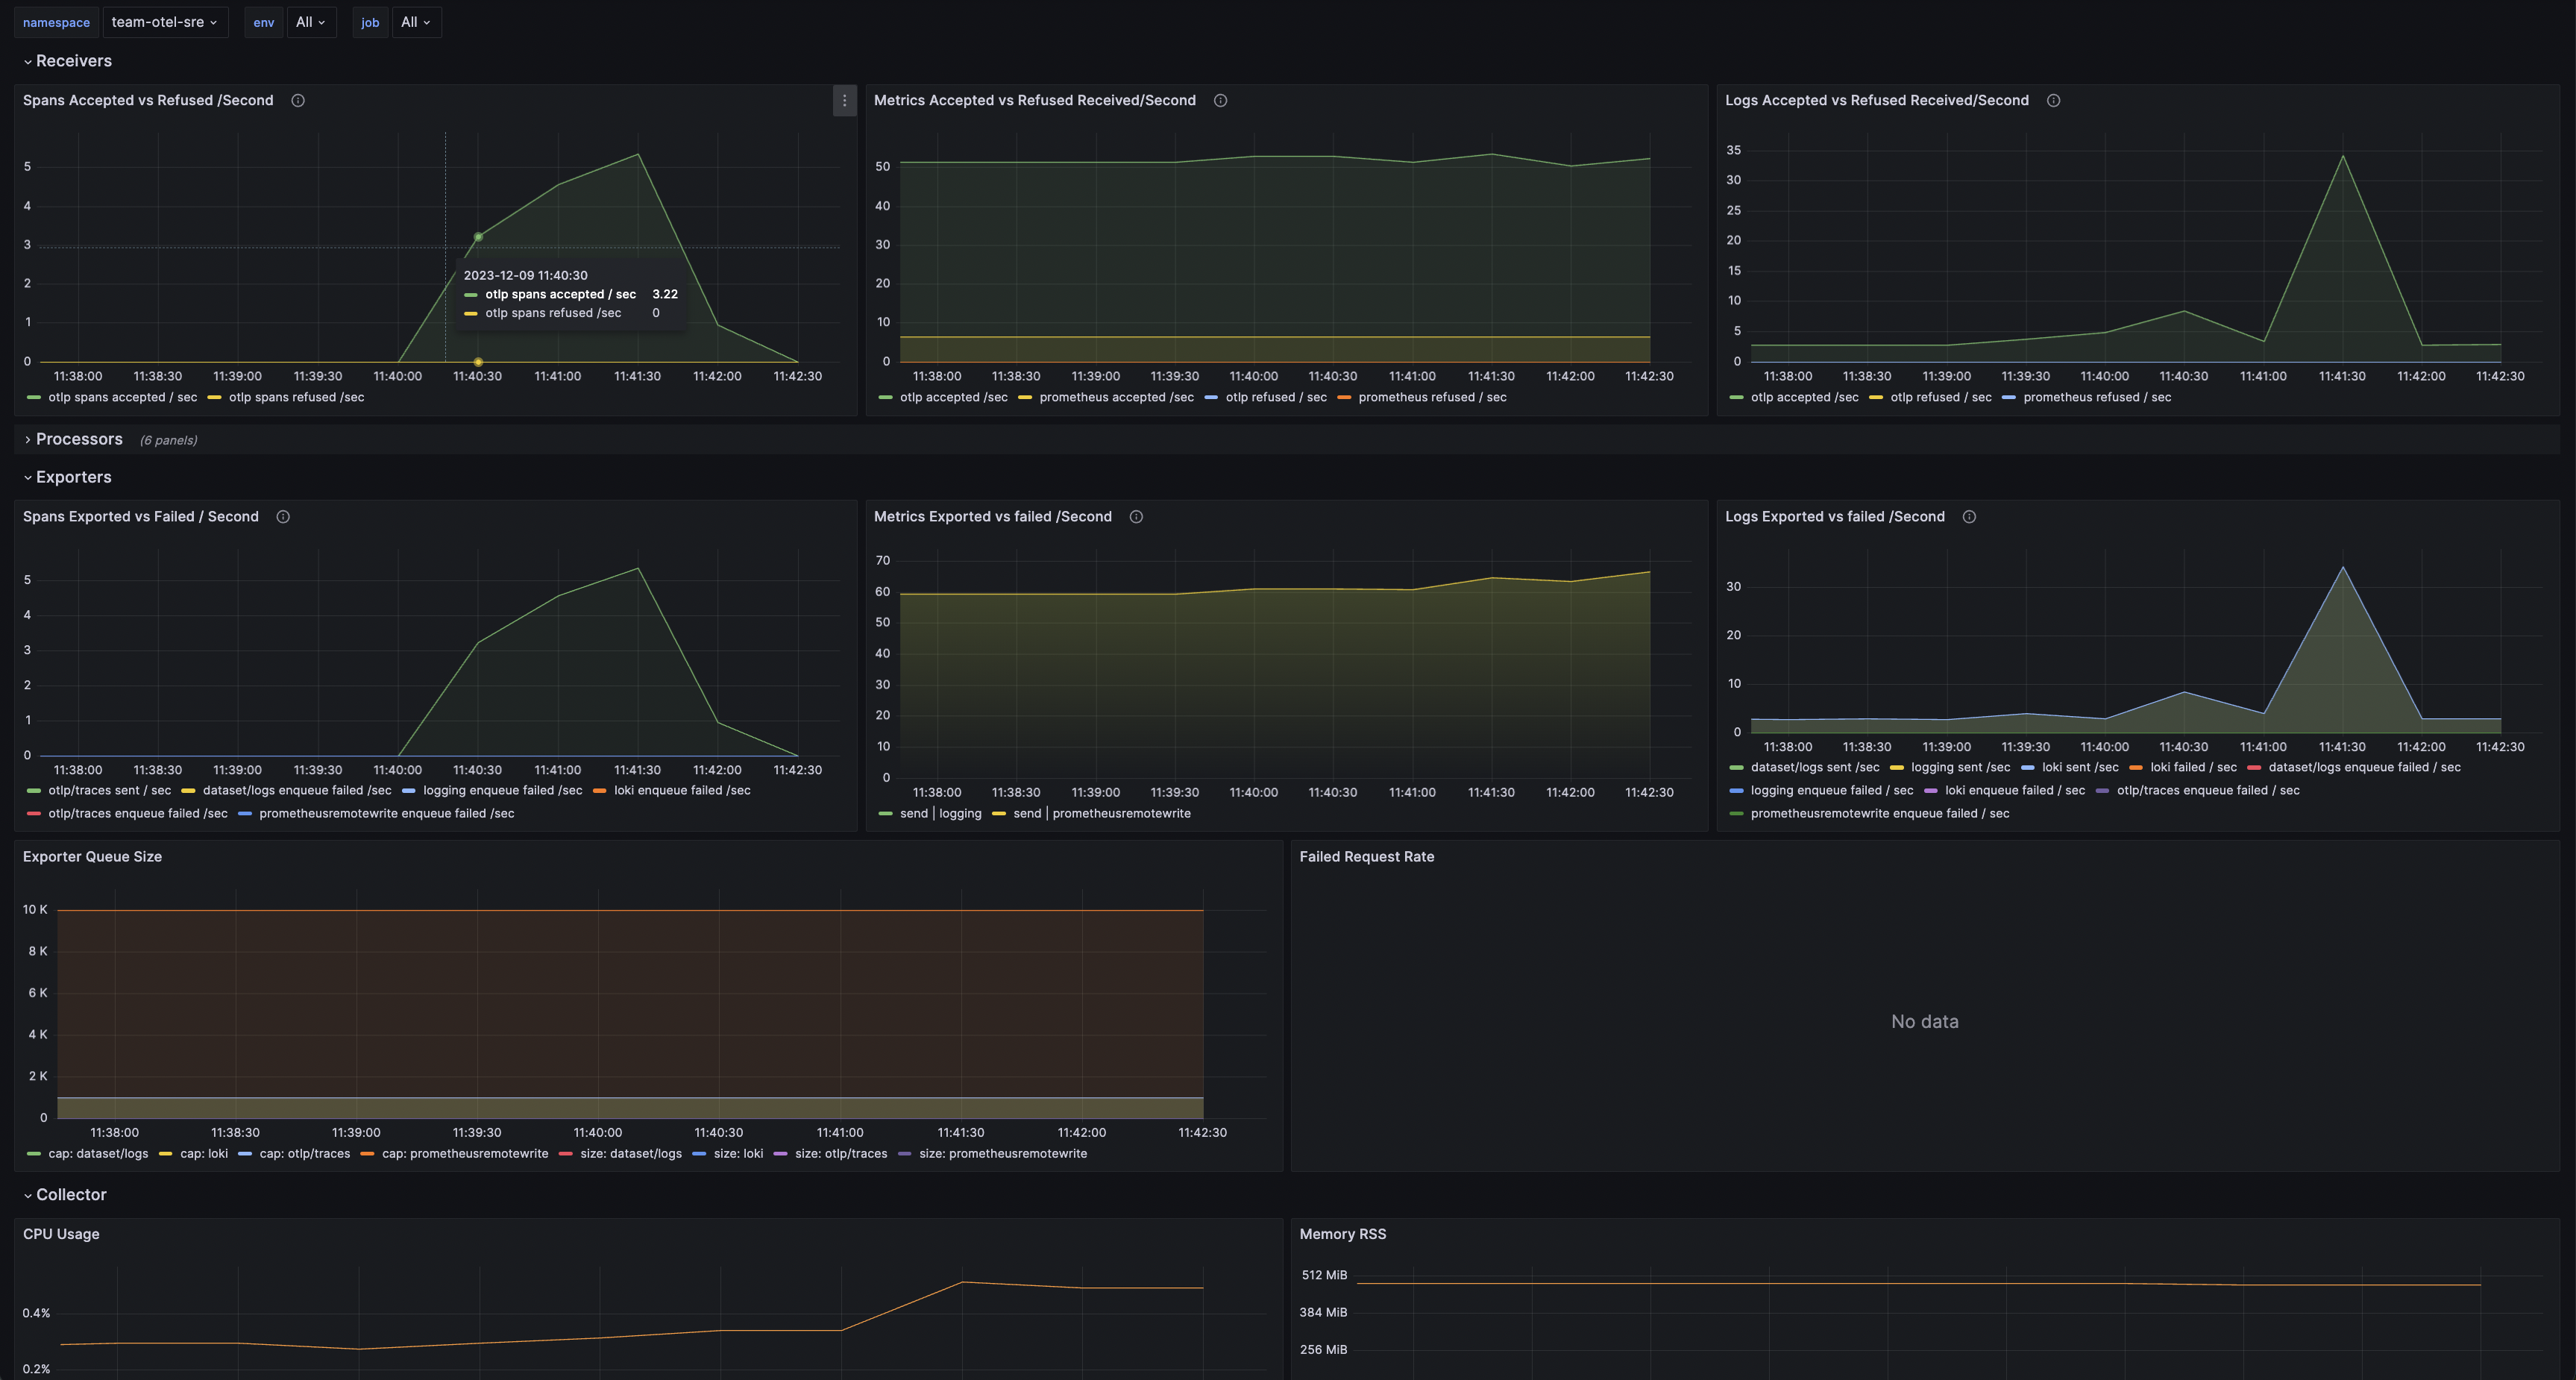
The above Grafana dashboard can be consulted for:
- Metric/Logs Accepted vs Refused,
- Metric/Logs Exported vs failed /Second,
- Exporter Queue size,
- Collector memory and cpu usage.
In addition to the OpenTelemetry-specific dashboards mentioned above, we also utilize Kubernetes dashboards that come with Kube-Prometheus. This gives us insight into all Kubernetes components.
To ensure proactive monitoring, we have set up alerts for key metrics following the best recommendations. These alerts are routed to PagerDuty, where we have on-call schedules in place.
What are the next steps?
Following the implementation of logs, our next focus is on introducing tracing to the teams. This step will empower teams to identify performance bottlenecks, dependencies, and the sequence of activities within their applications.
To facilitate teams in instrumenting their applications seamlessly, we propose starting with auto-instrumentation. This approach enables quick setup, allowing teams to experience the immediate benefits, such as the correlation between logs and traces. It’s especially advantageous for teams that may lack the necessary knowledge or time to implement custom instrumentation.
From the Observability team’s perspective, our next tasks involve delving into aspects like sampling (determining how much data is retained or discarded) and the propagation of context/headers (determining which one to utilize). Additionally, we aim to understand and manage the potential challenges posed by a cardinality explosion to ensure cost-effectiveness.
Conclusion
As we continue this initial phase of our journey, we are thrilled about the progress made in the ongoing Proof of Concept with OpenTelemetry. Starting with logs has proven to be an effective initial step, allowing us to transition gradually without the fear of disrupting existing processes. By providing teams the time to adopt OpenTelemetry, we anticipate onboarding more teams and gaining additional advantages, such as improved insights, better troubleshooting capabilities. This progress contributes to our ultimate goal of achieving superior observability within TomTom.
 Boosting Developer Productivity with GitHub Copilot: TomTom experience