I recently joined TomTom as a software engineer to work on its map visualization technology. Although relatively new to the company, I was inspired by TomTom’s strong vision to deliver a robust ecosystem of web tools for map creation. While we are working on delivering some new and exciting products, today I would like to share some of my previous experiences as a researcher in the 3D geoinformation group of TU Delft, having worked on 3D maps and the technology that is required to visualize massive 3D data on the web.
Why 3D?
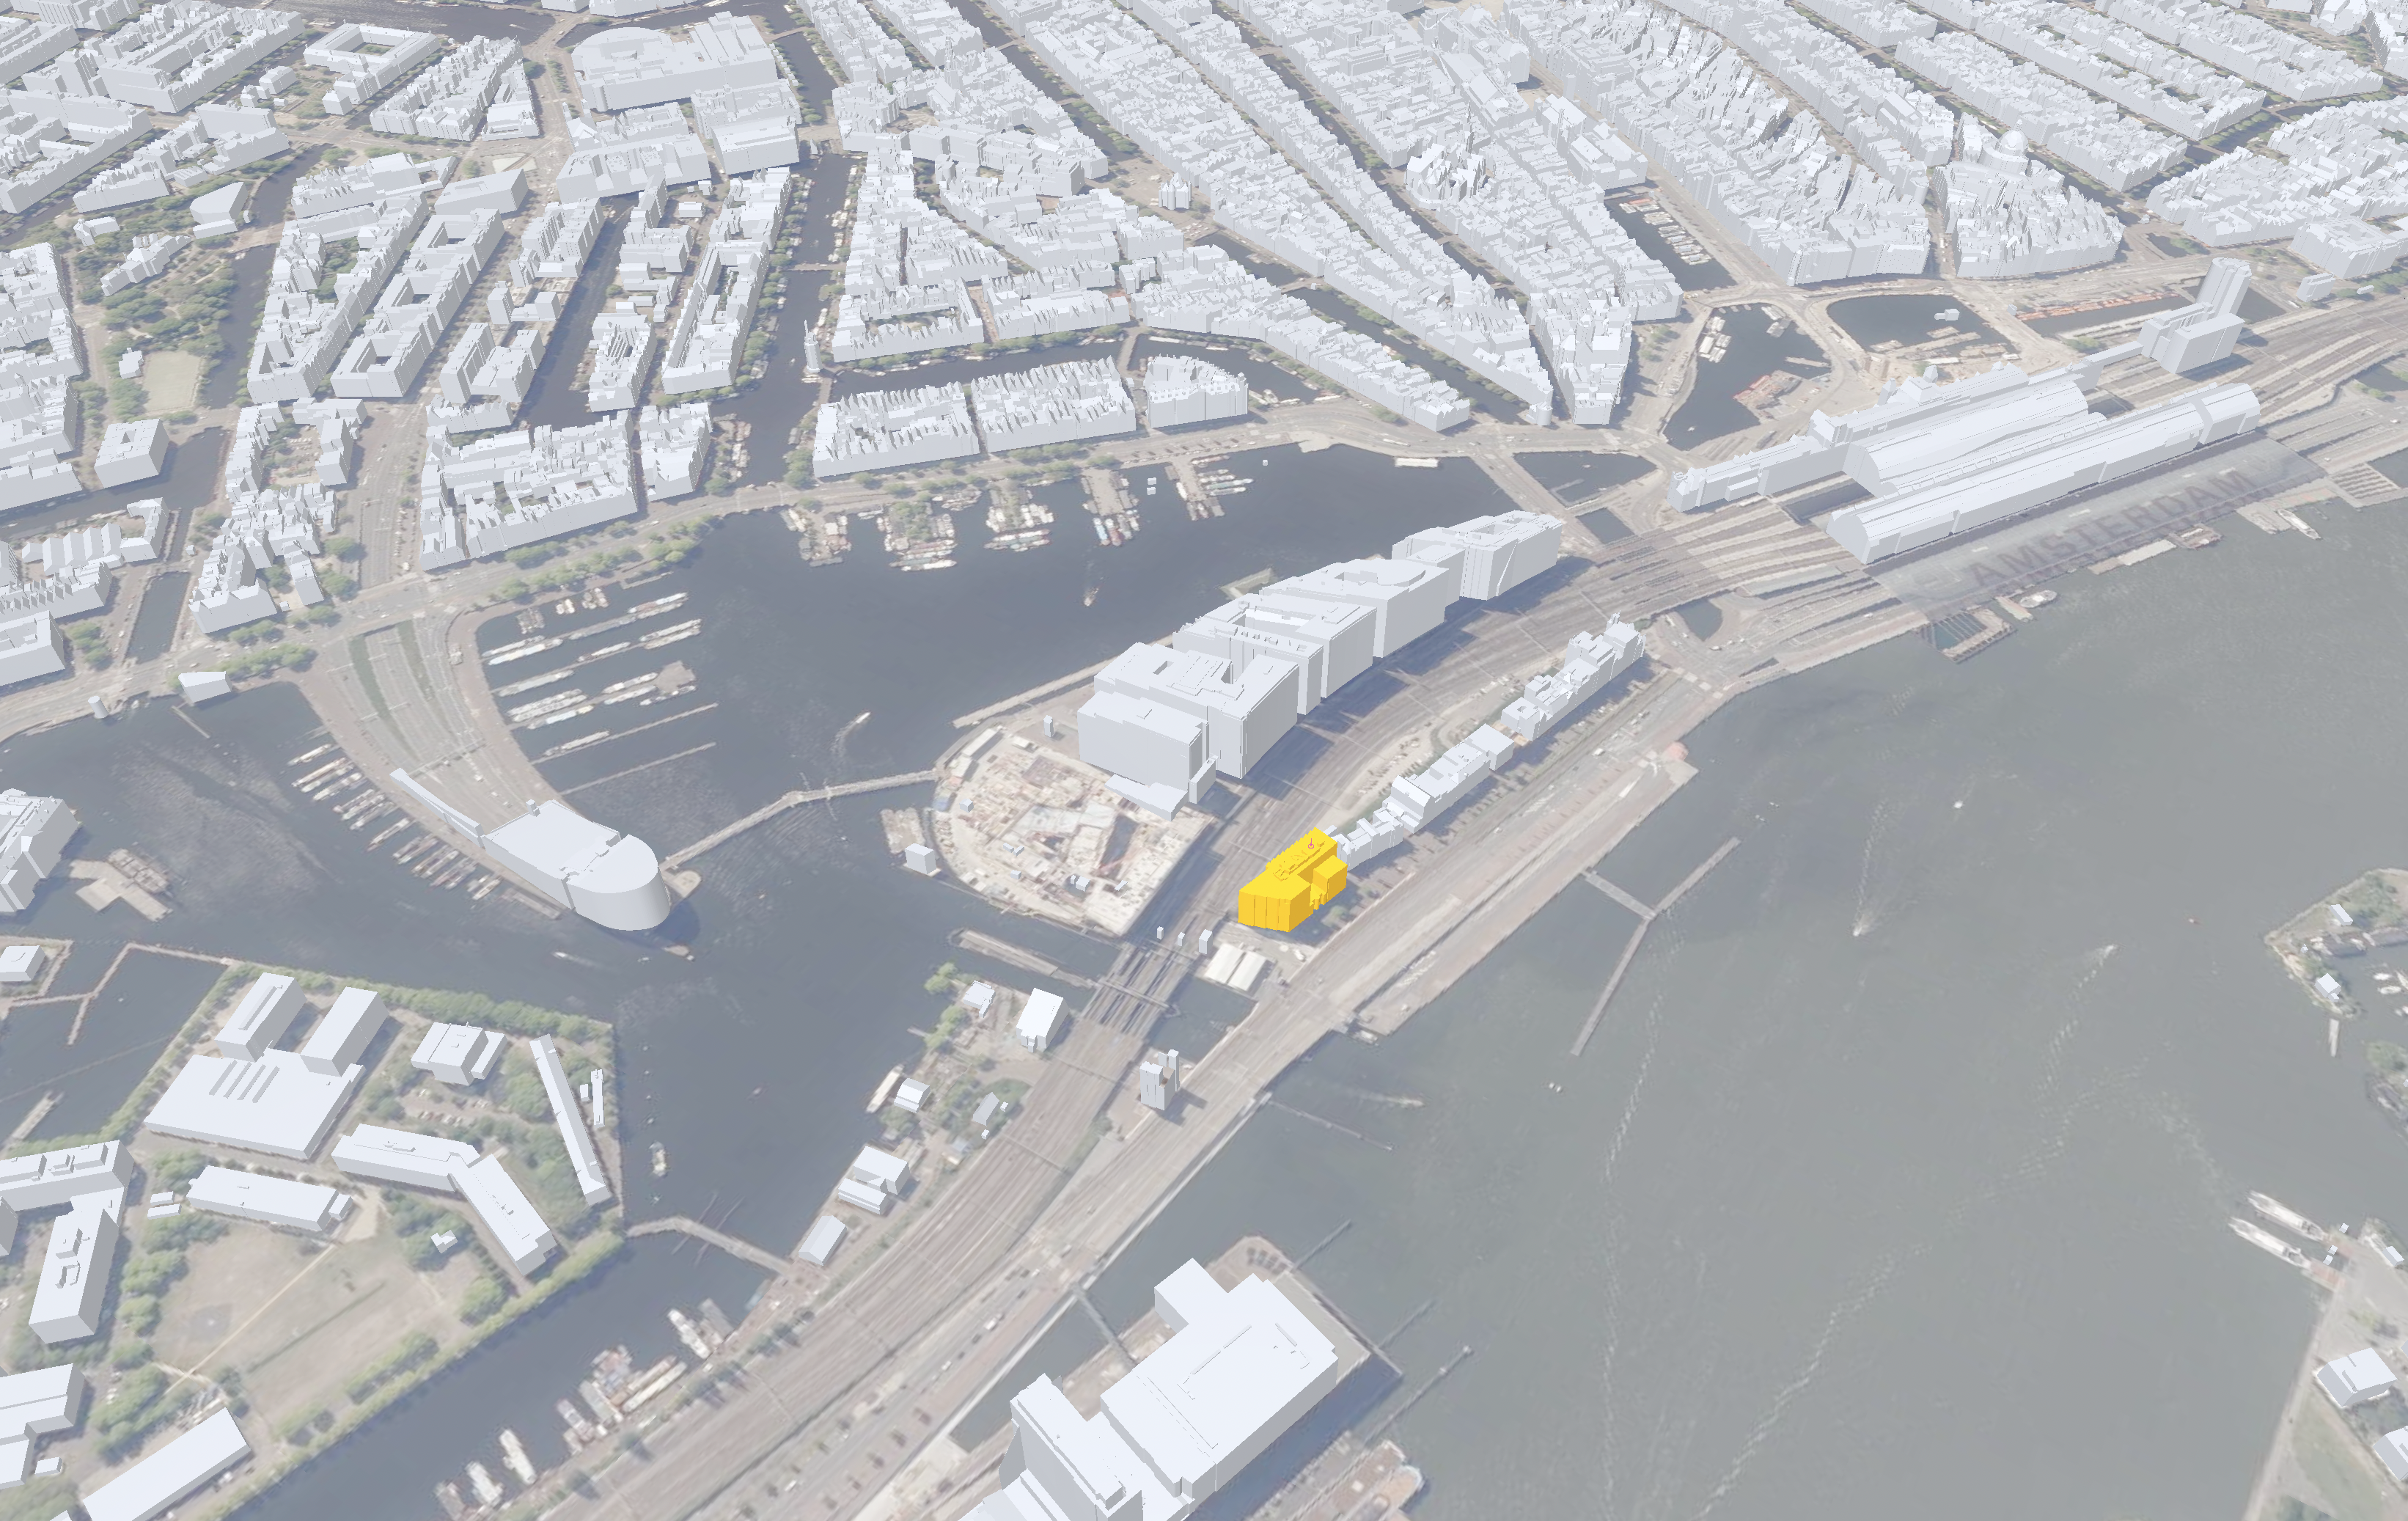
In case you haven’t noticed, our cities become more and more complex. As such, traditional two-dimensional maps become hard to manage and, sometimes, effectively obsolete. If you aren’t convinced, take a look at this photo:
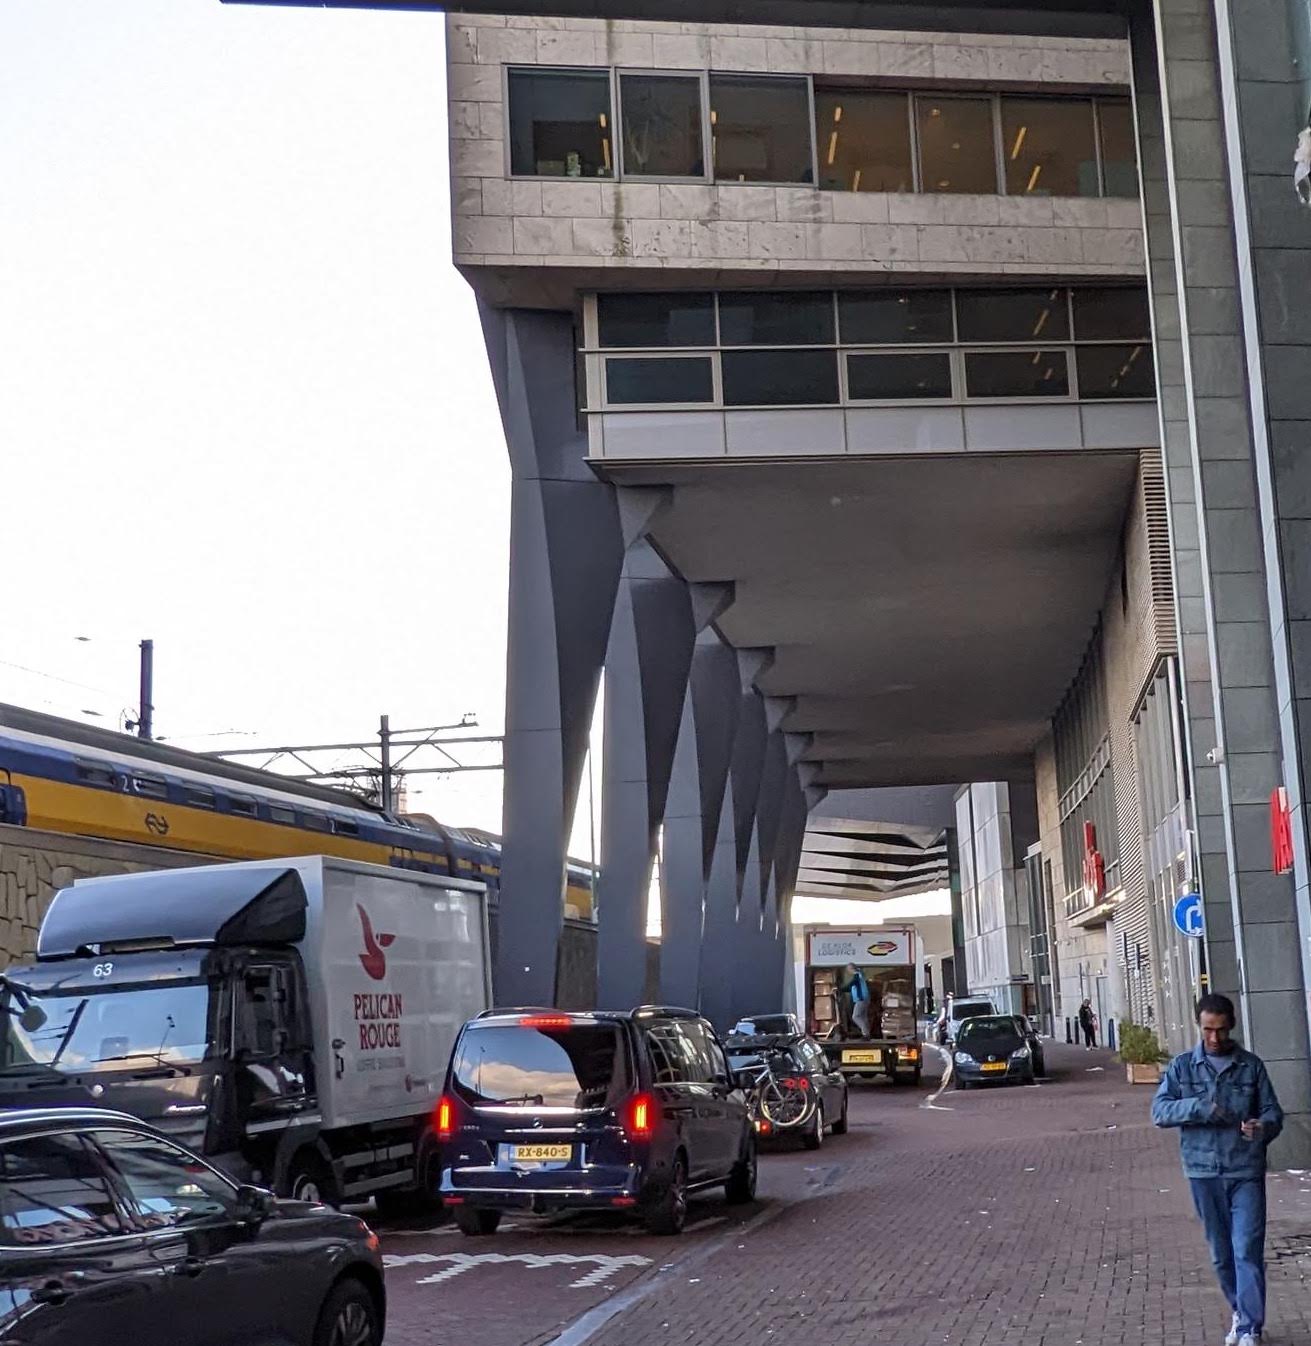
This is the entrance of one of TomTom’s buildings in Amsterdam. Notice how the building protrudes over the street and imagine how hard and unintuitive this can be when mapped in a simple piece of paper. The question is, why do we have to limit ourselves to plain 2D maps? Today’s computers (and all kinds of mobile devices, really) are more than capable of handling 3D data. Therefore, 3D mapping is possible!
As a matter of fact, there is a field working on these issues: 3D city models (often called “digital twins”) are 3D maps of our urban environment.
3D city…what? How do you store this?
Public organizations (map agencies, municipalities, cadastres) have been the driving force for 3D city models.
Early on, every initiative would use existing formats from different domains (e.g. obj or 3ds from 3D graphics, dwg from CAD), but eventually CityGML was released in 2008 as an open standard by the Open Geospatial Consortium (OGC) to cover this specific need.
CityGML, brought a structure to how a city can be represented, introducing a series of object classes (Buildings, Roads, Terrain etc.) to be used in such a 3D model.
Nevertheless, and despite the fact that many institutions adopted CityGML, software support for it was always lacking.
Even 14 years later and after 2 major releases of the standard (now under version 3.0.0), the amount of software that can read or write CityGML is limited; and, often, you’d feel grateful if the software is able to parse your file successfully!
This is, in general, due to GML’s ambiguity and verbosity (read about the so called GML madness) and XML’s implicit weakness in mapping with modern programming languages and practices.
Enter CityJSON! What originally started as a small project inside the 3D geoinformation group of TU Delft to encode CityGML in JSON, thus making parsing and storing CityGML data easier, became a community standard by the OGC. CityJSON is now supported by a plethora of software in the mapping domain and can be easily used by both users and developers.
Why I haven’t seen this before?
If you aren’t a 3D city model’s “expert”, chances are that this is all new to you. CityJSON and CityGML can be great for storage and exchange of 3D city models, but these solutions were mostly designed for domain experts. The real question is: “how can we bring this data to everyone”? You are probably thinking “the web”… and I think you are right!
Unfortunately, it took a long time for people to realize this. There were efforts to “democratize” 3D content by using tools such as Cesium. Rotterdam 3D and Switzerland in 3D are good examples of that. These solutions are Cesiums-based and, while they do the job, one can tell that each of these solutions seems to complicate things. To a GIS expert or a person comfortable with 3D viewers, these web apps can be appealing, but what has been noticed is that little do they do to reach out to a bigger audience.
While, in my opinion, these solutions didn’t bring much progress to the user experience of 3D data, a great result of these efforts was the creation of 3D Tiles and I3S. These are open standards that define how one can disseminate and visualize 3D geodata on the web; and they do not only focus on features such as buildings, roads etc. but also support more raw data, such as point clouds.
10 million buildings, you said. Where is that?
3D BAG is a nation-wide dataset for the whole of the Netherlands, created by the 3D geoinformation group of TU Delft. It is a “3dification” of BAG (BasisAdministratie Gemeenten), which is a map containing the footprints of all buildings in the country. Imagine about 10 million buildings with detailed roof shapes, automatically reconstructed by open data: that’s exactly what 3D BAG is!
Being involved in the project, I can bring some insight on the decisions made to build a web viewer. The project’s top priority was a way to make this data easily discoverable and accessible by everyone. That effectively means to make the data appealing to the user: a web app that is straightforward, performs well and doesn’t overwhelm the user with too much information.
Having realized that there are no of-the-shelf solution for this, the team decided to build its own solution. 3dbag.nl was created using technologies such as three.js and 3DTilesRendererJS. The app is using a simple WMTS basemap and focuses on highlighting what’s important: the data (i.e., the buildings)! There are no distractions and unnecessary bells and whistles. If one is interested in a building, they can click on it and get the information they want. Everything else was, also, made as accessible and easy to users as possible: people can report issues and make remarks on the data quite easily. And, of course, they can easily download their area of interest.
The future of 3D on the web
What I can say from encountering this journey, is that the future for 3D on the web can be bright. WebGL provides a strong foundation for visualizing 3D in a browser, and WebGPU will make 3D on the web even more robust. Three.js builds on top of that and can be used to build all kinds of interesting experiences on the web. MapLibre also builds on WebGL, to enable the creation of good-looking and well-performing maps on the web. CityJSON and 3D Tiles can enable complete 3D geodata solutions. They are well documented and the tools to work with them are maturing vastly. And what’s even more exciting: all the above is open source and open standards!
What about TomTom?
TomTom has always been a pioneer in digital mapping solutions and has included 3D data in its products, such as on-board navigation, for years. What lies ahead is TomTom’s journey to an even more data-rich future, with the strong integration of OSM data and the ability to integrate a multitude of open data sources, a lot of them containing 3D data. I can only see our future on the web having a strong 3D presence and I am excited to bring my experience on board to make this a reality!
 Triggering dynamic Spark tasks on Databricks with Apache Airflow